
Baseball is a study in anomalies. We pay attention to the big numbers, those that stand out from the rest of the pack. One of those magical numbers is 50 home runs. George Foster and Cecil Fielder became baseball sensations by eclipsing that mark in 1978 and 1990. While neither can be said to have come out of nowhere, neither had touched the 30-homer mark prior to those breakout seasons. Fielder himself had previously topped out in American baseball with 14 dingers. If he could do it, anybody could potentially be the next Babe Ruth.
Those out of nowhere power surges had some precedent. Go back to the days of Ruth and look at the lineup he faced when he swatted his final three home runs. Ruth was with the Braves in the National League in 1935 and was playing against the Pittsburgh Pirates. Batting sixth for Pittsburgh was a first baseman who hit 84 career home runs, topping out with 17 in his rookie season.
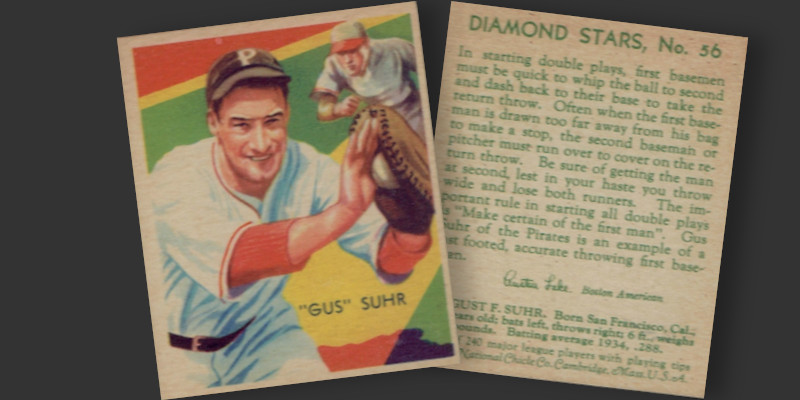
The Pirates’ Gus Suhr had punched his ticket to National League when he turned in one of the greatest professional baseball seasons of all time. By 1929 he was an established player in the Pacific Coast League, a circuit that had prior to the expansion era been considered as a potential addition to the National and American Leagues. That year he clobbered 51 home runs while racking up 299 base hits and well over 500 total bases. That single season power surge generated almost as many longballs as he had hit in his career to date. It also generated the first known lawsuit from a fan being struck by a fall ball, which happened to come zooming off Suhr’s bat.
Today Suhr is better remembered for a then-record setting consecutive games streak of 822 contests. He played through injuries, only stepping out of the lineup to attend his mother’s funeral in 1937. While tougher East Coast pitching and a shorter season contributed to his never approaching 50 homers again, his habit of playing through injuries likely contributed to the drop off in production.
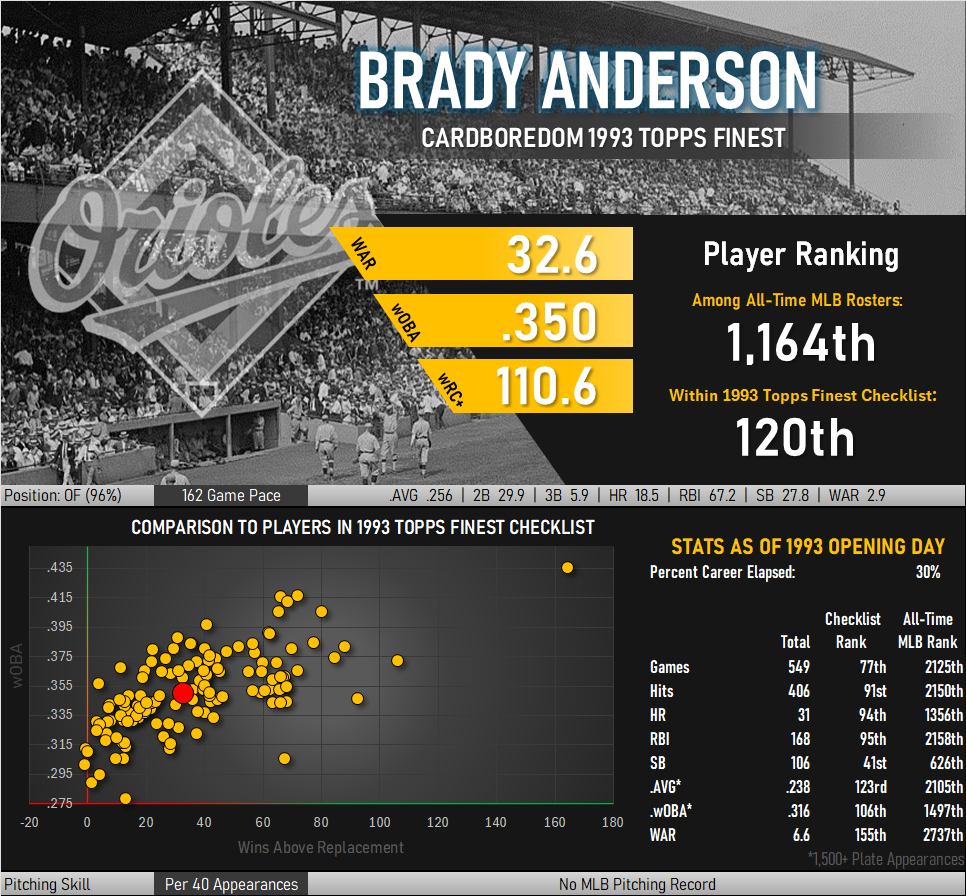
After Cecil Fielder’s 50 home run barrage in 1990, a few more names were soon added to the 50-homer club. Albert Belle and Mark McGwire, both feared longball threats tattooed their names on the list in 1995 and 1996. So did a little known outfielder better known for stealing bases: Brady Anderson.
It took Anderson 4 MLB seasons to record his first 10 cumulative dingers. He surged to 21 in 1992, which would easily remain his high water mark through the end of the 1995 season. He launched an incredible 50 longballs in 1996 before his annual totals immediately plummeted back into the teens for pretty much the rest of his career. It seems like everyone that season collectively looked around and asked, “What just happened?”
Anyone posing this question almost certainly gets a one word response: “Steroids.”
To many fans, Anderson is the poster child for PED suspicion. His 1996 campaign has long been viewed with skepticism. In the height of the steroid era, such a spike was enough to raise eyebrows (and accusations).
But what if that explanation is wrong? In a compelling article from SB Nation’s Beyond the Box Score, writer Joe Vasile lays out a detailed case for why Brady Anderson may have been clean all along. And I have to say I agree with his assessment. The evidence, when examined closely, paints a picture not of a juiced-up slugger, but of a gifted athlete who had one magical season, just like Gus Suhr.
Let’s walk through the high points of Vasile’s argument.
1) Anderson was no slouch. From his early days in the minors, he showed a rare combination of speed, patience, and power. His athleticism was evident, and his reputation as a workout fanatic was well established as a college athlete long before his selection in the 1985 Amateur Draft.
2) While Anderson’s 50-homer season was undeniably an outlier, it wasn’t entirely without precedent. From 1992 to 1995, he averaged around 14–16 home runs per season, with solid slugging percentages and on-base skills. He was a legitimate offensive contributor, not a fluke. In 1996, everything clicked—his swing, his health, and his lineup protection.
That year, the Orioles were stacked. Anderson batted ahead of future Hall of Famers like Cal Ripken Jr., Roberto Alomar, and Eddie Murray. The lineup also featured Rafael Palmeiro, Bobby Bonilla, and B.J. Surhoff. With so much talent around him, Anderson likely saw better pitches and had more opportunities to drive the ball.
3) It wasn’t just Anderson. The entire American League saw a spike in home runs in 1996. The league average for home runs per at-bat jumped significantly compared to 1995 and 1997. Statistical anomalies happen, and Anderson’s season may have been the most extreme example of a broader trend.
4) Anderson was never named in the Mitchell Report, the most comprehensive investigation into PEDs in baseball history*. He denied using steroids, and while denials are common, the lack of any concrete evidence is notable. If he had used, why was there no trace?
Moreover, Anderson’s weight remained relatively stable throughout his career. From 1989 to 2001, his listed weight fluctuated only slightly, from 186 to 202 pounds. In fact, his weight decreased from 195 in 1995 to 190 in 1996. That’s not what you’d expect from someone allegedly bulking up on steroids. As Vasile humorously puts it, “…if those numbers are true and Anderson took steroids, then he is the worst at taking steroids that has ever lived.” Instructions unclear: Got smaller.
*[I have massive reservations about the comprehensiveness of the Mitchell Report. It is nowhere near satisfactory in terms of answering the question of who was using what, but it does a decent introductory job considering the handicaps under which its investigators were operating. Still, it seems likely that Anderson wasn’t sourcing any PEDs from the sport’s most popular avenues.]
5) After 1996, Anderson battled a series of injuries—fractured ribs, neck strains, muscle pulls—that hampered his performance. These weren’t minor tweaks; they were serious setbacks that affected his swing and power. Combine that with the natural aging process, and it’s no surprise his numbers declined. 1996 was pretty much the only time where we saw a completely healthy Anderson get to play.
Vasile makes a poignant observation: we love conspiracy theories. From moon landings to celebrity rumors, there’s something satisfying about uncovering a hidden secret. In Anderson’s case, the steroid narrative fits neatly into our expectations of the era. But neat narratives aren’t always true.
Anderson was a three-time All-Star, a member of the 20-50 and 50-20 clubs, and a player who brought excitement to Baltimore. His 1996 season was extraordinary, but not necessarily suspicious. Like Gus Suhr decades earlier, Anderson may simply have had one of those seasons where everything aligned. Vasile does a much better job of fleshing out his argument than I, and I encourage you to go read it in its entirety.
Maybe, and by “maybe” I mean “I am more convinced of this than almost any other player of his era,” Brady Anderson was clean.
I want to add a few of my own thoughts to Vasile’s case for hitting a clean 50 HRs.
The Workouts
Anderson was widely known to be highly dedicated to spending quality time in the weight room. He was 6’1″ tall and usually weighed in in the low to mid 190s. This is well inside the range of natural athleticism and from personal experience lifting weights and counting macros represents an physique attainable without pharmaceutical assistance. This is pre-home run chase Barry Bonds territory, and being in good shape seems correlated with hitting the long ball (skinny Bonds himself hit 46 home runs during Anderson’s amazing season).
Yes, I understand the gym’s Smith Machine is the most likely location to find your standard pharma bro. However, there are generally two types of users: Those taking more intense cycles trying to get absolutely massive and those looking for a boost to recover from injury and maintain performance over a long baseball season. The psychology of steroid/HGH use usually sends gym rats down the “get bigger as fast as possible” path leading to new hat sizes and needing new shirt sleeves on a regular basis. Anderson never showed signs of this extreme bulking tendency, leading me to believe that if he used he was on the less problematic recovery/stamina assistance end of the spectrum. This is a key difference for looking at his 50 homer season, as small doses are not going to turn a 15 home run campaign into a 50 home run season overnight.
“Out of Nowhere” Power
It wasn’t his outward appearance that raised suspicions, but rather the sight of a guy who had only eclipsed 20 home runs once in his first 8 big league seasons suddenly clobbering 50. Yeah, that’s a lot. However, I don’t think it would have gotten the attention it did had he not hit the big round number of 50. Anderson hit a lot of home runs in his career (210), 24% of which came in that one season.
Who else saw a single outlier season account for such a large percentage of career homers while also hitting at least double their highest single season HR totals? Bert Campaneris his 28% of his total homeruns in 1970, nearly tripling his second best HR tally. Jacoby Ellsbury, a very Brady Anderson-esque speed guy, hit 30% of his career home runs with 32 longballs in 2011 while doubling his second highest figure. Davey Johnson hit 43 longballs in 1973 (32% of career HRs) while outpacing his second best high of just 18 homeruns.
These surges happen more often than you think.
“Jacked” Rabbit Ball
Sometimes there are additional factors at play. Just look at Wade Boggs, who more than doubled his second best HR production to hit 20% of his career dingers in a single season. He hit 24 homeruns in 1987, a year that became widely known as the year of the “Rabbit Ball.” Offense exploded that year with the prevalence of homeruns increasing from 1 every 42 plate appearances to 1 every 36. After widespread speculation and complaints about this lively so-called “rabbit” ball, ball characteristics seemed to go the other direction in 1988 with 1 HR per every 50 plate appearances. Home run totals were different in 1987, everybody sat up and collectively said, “huh, that’s interesting,” and then everything went back to normal.
Here’s where things get a bit interesting. The final full season before the players’ strike saw 1 HR hit for every 51 plate appearances. In 1996, the first full season after the strike, longball production went right back to 1 HR per 36 PAs, the same as the year of the rabbit ball.
Jay Jaffe really delved into this in a 2012 essay “What Really Happened in the Juiced Era?” which is helpfully reproduced online (go read it here). What comes across is a recurring story of baseballs going through an evolution of production standards over time, sometimes resulting in balls that travel as much as an extra 50 feet, enough to turn the regular fly outs of a guy like Anderson into homeruns that just scrape past the wall. Anderson wasn’t hitting moonshots in 1996, but he was undoubtedly clearing fences at an increased rate (1 HR per 14 PAs vs averages closer to 1 HR per 40 PAs).
MLB has long held that there has been no change to baseball specifications over much of the past century. This is demonstrably true and false at the same time. It is true so far as the overall minimum and maximum specifications of baseball construction go. Balls must be within specified tolerances that have seen little change. However, the range between the upper and lower limits is quite large in terms of how a ball behaves at both ends of the spectrum. A properly incentivized manufacturer can “lean” on production towards either end of the range and generate baseballs capable of specific in-flight tendencies. To think this targeted output has remained unchanged since 1931 is highly unlikely.
So what happened in 1996? My guess is the ball was at the most energetic end of the spectrum (but still technically in line with specs) just after the strike. If the ball was subtly tweaked, even within legal tolerances, that might’ve been just enough to turn warning-track outs into box-score homers. This timing coincided with Brady Anderson finally staying healthy, dialing in his swing mechanics, and catching fire with one crazy hot streak. It’s a Venn diagram with a very small area of overlap, but one I find plausible.
Anderson’s Surprisingly Hard to Find Cardboard
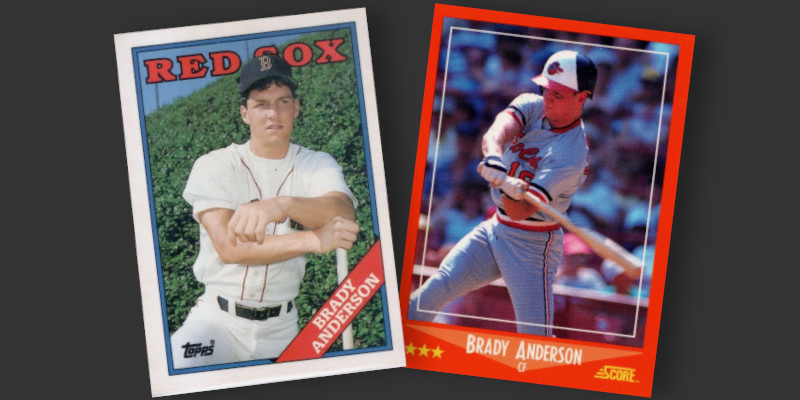
Brady Anderson’s career began in the heart of the Junk Wax Era, yet a good number of his rookie cards can be challenging to locate. Every single one of his 1988 rookie cards was issued as part of a yearend set. Sure, this was a time period in which hobby shops ordered cases of these boxed sets by the metric ton and examples of his Topps Traded, Score Rookie & Traded, and Donruss The Rookies cards were printed to the moon. If you say “Junk Wax on Steroids” one’s mind probably conjures up the image of blue and red borders from ’88 Donruss.
Despite this relative lack of scarcity, I bet you don’t have the special edition versions of any of these cards. Donruss sold limited numbers (i.e. there was low demand) of team sets in fold out books. These books included versions of players’ traditionally uninspired ’88 Donruss cards, but crucially had more up to date checklists. While Anderson never appeared in the regular 1988 Donruss checklist, he makes an appearance on one of these team set editions.
By this point Topps was into their fifth year of producing “Tiffany” boxed sets, special higher quality editions of their base and traded offerings. The company printed 30,000 of these glossy Anderson rookies, a number likely 99% smaller than your standard card from the base version of Topps’ 1988 regular season cards. Tough, but not impossible.
How about this for a sneakier challenge? Score jumped on the glossy parallel train with its own special edition of their Rookie & Traded boxed set. Score reportedly made just 3,000 glossy sets, setting less than half as many of these cards into the wild as other famously tough cards like ’91 Topps Desert Shield or the Donruss Elite cards of the same era. Putting this into perspective, this is very close to the number of autographed insert cards Upper Deck issued each year in their famous Heroes sets (Reggie Jackson, Hank Aaron, Nolan Ryan, etc.).
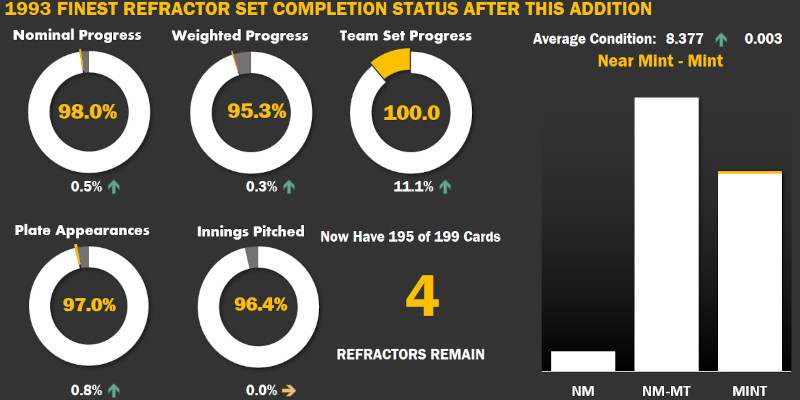
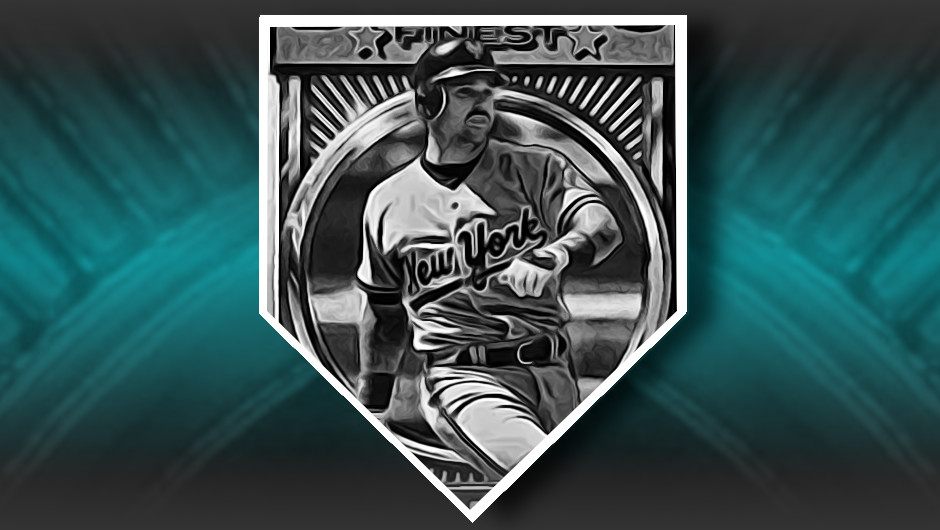
Of course, as a fan of Refractor cards you know I am immediately drawn to hard to find cards from the Junk Wax Era. Any ’93 Finest Refractor is of interest to me, and its even better if it shows a player who was significantly better than a generic common name. He’s not the kind of household name that gets set out in dealer display cases like a Bonds or Griffey, so finding this card is expected to be a bit of hunt. What makes Brady Anderson’s refractor so intriguing is how difficult it can be to spot one of these in the wild.
At this point I’ve been tracking every Refractor transaction I can get my hands on for years. One exercise I have found useful to apply to this database is to test whether or not a particular card is consistently seen rarely or often. Multiyear “shortages” of any given name are perfectly normal in a random cross section of the checklist, but a consistent lack of transactions for a name across time periods is worthy of a closer look.
The shiny Anderson card is in the bottom quintile of observed transaction counts for the current decade. After dramatically saying “Mr. Anderson” in the manner of an agent from The Matrix, I pulled up transaction data going back to 2000 and separated it into equally sized segments of time. One would expect a card to randomly drift from quintile to quintile over time, sometimes being abundant and other times rarely being seen. The result? Brady Anderson cards were right in the middle of the pack in the early 2000s and again in the latter half of the 2010s. They were in the bottom quintile in between these periods. Conclusion? The card is tough, but not absurdly so compared to any other name from the ’93 Finest checklist.
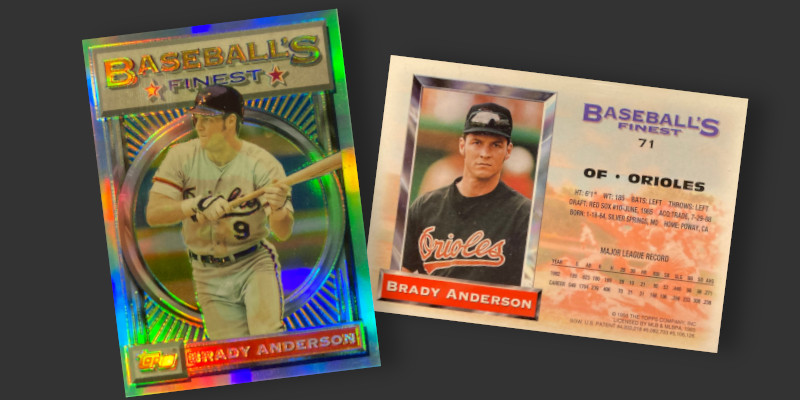
This information didn’t stop me from getting too eager to cross this name off my Refractor checklist and overpaying for my card. It’s “officially” in mint condition according to PSA, but is a little bit off center and carries a whiff of greening in the image of our sideburned subject. The color looks a bit “off” on the front, almost looking a bit faded. The card shop selling this had about a dozen different Refractors in stock, and each one looked like they had been displayed in the sun for a little while. Still, I shrugged it off and bought this one anyway. It’s really hit or miss when I look at my card – sometimes in hand it looks just fine and other times the coloring looks muted. It’s really an odd condition card. This is one of the first examples that come to mind when I remind myself to wait for the “right” card when I see something needed to fill a hole in my collection.