I know, I know, there are tons of small writeups written that argue for or against the inclusion of Barry Bonds into the Baseball Hall of Fame. This isn’t one of them. It’s not about second-guessing the baseball writers’ association balloting or handicapping the odds that a future eras committee will reconsider his case. This is just a simple question: What would Barry Bonds’ career stats look like if he had to replay his entire career against only Hall of Fame pitching?
Bonds faced off against 15 different pitchers who are currently in Cooperstown. Nearly two-thirds of these contests came against the Atlanta Braves’ trio of Greg Maddux, Tom Glavine, and John Smoltz. The addition of Pedro Martinez and Randy Johnson takes the sample to 85% of his career-HOF matchups with an assortment of other guys making up the rest. The rest are no big deal, just your usual firing squad of Nolan Ryan, Mariano Rivera, and 8 others. Here is how he fared against these 15 pitchers:
| Home Runs | .AVG | .OBP | .SLUG | OPS |
|---|---|---|---|---|
| 28 | .297 | .427 | .563 | .991 |
That triple slash line of .297/.427/.563 shows Bonds was terrific against the league’s best pitching. However, those numbers don’t hold the same weight as some of the major counting stats in fans’ minds. What would Bonds’ career stats look like if he took all 12,606 of his career plate appearances against only this 15-man rotation?
To come up with these numbers I made a few assumptions. First, our alternate-universe Barry Bonds would face each pitcher in the same proportion as he did in real life. That means He has to go head-to-head with Greg Maddux in 28.6% of his trips to the plate. Second, I assume any additional at-bats generated by these pitchers’ lower walk rates result in the same level of offense as his other production against the same cohort of pitchers.
The results of 12,606 trips to the plate against 15 guys with bronze plaques:
| AB | H | BB | HR | .AVG | .OBP | .SLG | .OPS | |
|---|---|---|---|---|---|---|---|---|
| Actual Career | 9,847 | 2,935 | 2,558 | 762 | .298 | .444 | .607 | 1.051 |
| Only HOF Pitching | 10,109 | 3,013 | 2,296 | 651 | .297 | .427 | .563 | .991 |
Facing only pitchers in Cooperstown, the alternate-reality Bonds sees his batting average drop by just a single point. That doesn’t hurt much, as he makes use of these pitchers’ lower walk rates to join the 3,000 hit club. His walk total is reduced by about 10% but is still good enough to make him the MLB career leader. He hits about 100 fewer home runs in the HOF-pitching scenario, giving him career numbers almost identical to Willie Mays. His career OPS would fall to 13th all-time, between that of Mike Trout and Mark McGwire.
Bonds, it seems, would absolutely clean up at the annual Hall-of-Fame exhibition game.
Walking with Bonds
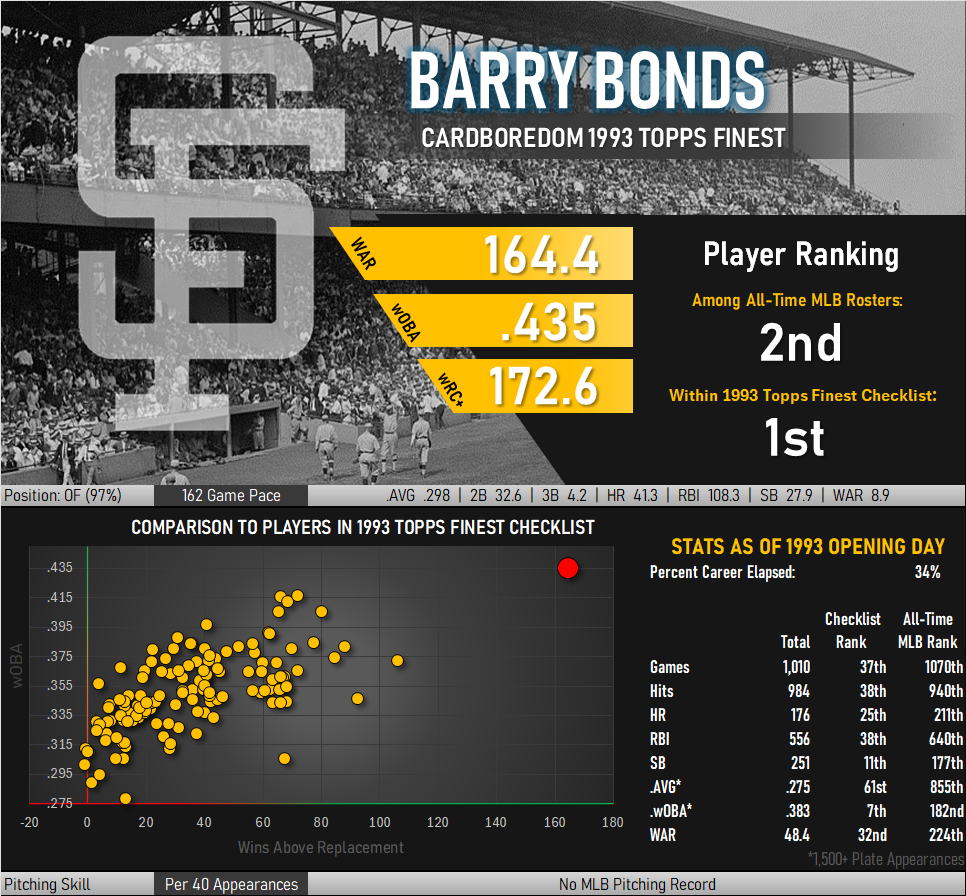
Barry Bonds has the highest walk rate of any player featured in the 1993 Topps Finest checklist and is second in this regard only to Ted Williams in the history of baseball. He drew 232 walks in 2004, more than half of which were the intentional variety. Couple this with being hit by 9 pitches and you get more than 4 miles of Bonds just strolling to first base. Factor in 45 appropriately-paced home run trots and you get over 2 hours of Bonds pacing himself around the bases, or more than a minute per game. The average baseball game lasted 2 hours and 42 minutes last season, 9 minutes shorter than in 2004. I like to think some of that reduced time is not having to wait for Bonds to take his base.
The stat sheets report Bonds’ batting average was .362 in 2004, but it could have been much, much higher. Batting average is a metric born in the earliest days of the game and its simplicity lends itself to the limited data of the era. Early statistical keepers fiddled with the inputs for years before settling on something resembling its current form of hits divided by at-bats. Prior to 1889 scorekeepers counted walks as the equivalent of a base hit. If Bonds’ 232 walks are accounted for in the pre-1889 method, his 2004 batting average would have been an astounding .607. His career batting average would have been .443 under these rules, much higher than Ty Cobb’s walk-adjusted career batting average of .429 under the same methodology.
Three Attempts at Landing a Bonds Refractor
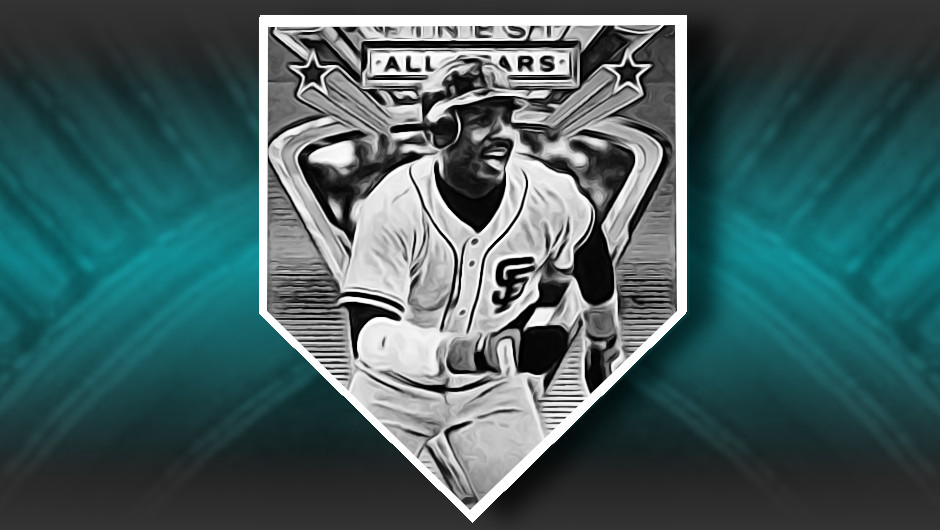
Barry Bonds was very good at working deep into the count. This trait apparently extended to my baseball card collection as well. It took three separate tries to acquire the Bonds card for my ’93 Finest set build.
The first of these came when a smaller auction house held one its bi-weekly events. A graded NM-MT example of the Bonds card was featured as one of the lots and I placed a bid. This particular auction house uses an extended bidding format in which they will only accept additional bids from collectors who have already placed a bid for that particular item. After the extended bidding period has been begun, each lot remains open until 15 minutes have passed with no additional activity for that particular lot. I went to bed on the final night of the auction, seeing that I had been the high bidder at the conclusion of both preliminary and extended bidding. Imagine my surprise two days later when I received an email stating there had been a glitch preventing some extended bids from being received and announcing bidding would be reopened for a new 15-minute countdown. I logged in to see the Bonds auction had already been reopened and closed with someone else being declared the high bidder. This was a frustrating experience, and while it saved me time in bothering to check this auction’s listings in the future, I still needed to find this card for my set.
I returned to my daily bookmarked searches across multiple sales platforms and found a seller at one of my regular search targets in the process of actively listing a new refractor every 2 minutes or so. The seller was breaking up a partial set with most stars in the near-mint range and commons appearing in higher grade. The site had a dynamic news feed showing the most recent dozen or so transactions and I could see someone else was busy purchasing these cards almost as fast as they were being listed. I joined the fray and we soon fell into a rhythm of having a shot at every other card. I passed on a few and then jumped into action when the Mike Piazza card was offered. While I was engaged with the acquisition of the Dodgers’ catcher, my competitor took the opportunity to purchase a Bonds refractor that was listed while I was involved in the checkout process. I reached out to the new owner and inquired about buying it and providing him with a quick profit but received no response.
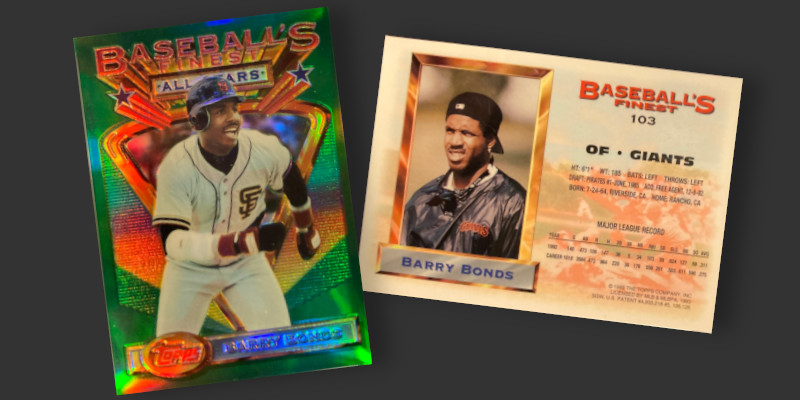
Now 0-2 in my search for the card, I decided to pass on the off-speed stuff being offered to me. With Bonds being one of the most recognizable cards in the set and at least 50 examples observed changing hands in 2023 the card is readily obtainable. The limiting factor is price. Asking prices for this card can be insane. I had zero interest in paying $500+ for NM cards or $1,000+ for NM-MT examples, sticker prices that appeared with some regularity when I encountered them in the wild. Like a patient Giants slugger, I waited for my pitch. Over one year later I found one in mint condition from a collector breaking up his refractor collection. The card was purchased for less than some of those aspirational prices and I found my set one major card closer to completion.
