Baseball card collecting changed dramatically in 1993. The end of the junk wax era arrived and with it came a set of cards that looked like nothing else. Completing a set of the elusive 1993 Finest Refractors once seemed impossible but is now the primary goal of my collecting interests. This page serves as a clearing house for information on both my set building progress and the underlying cards.
Refractor Dashboard
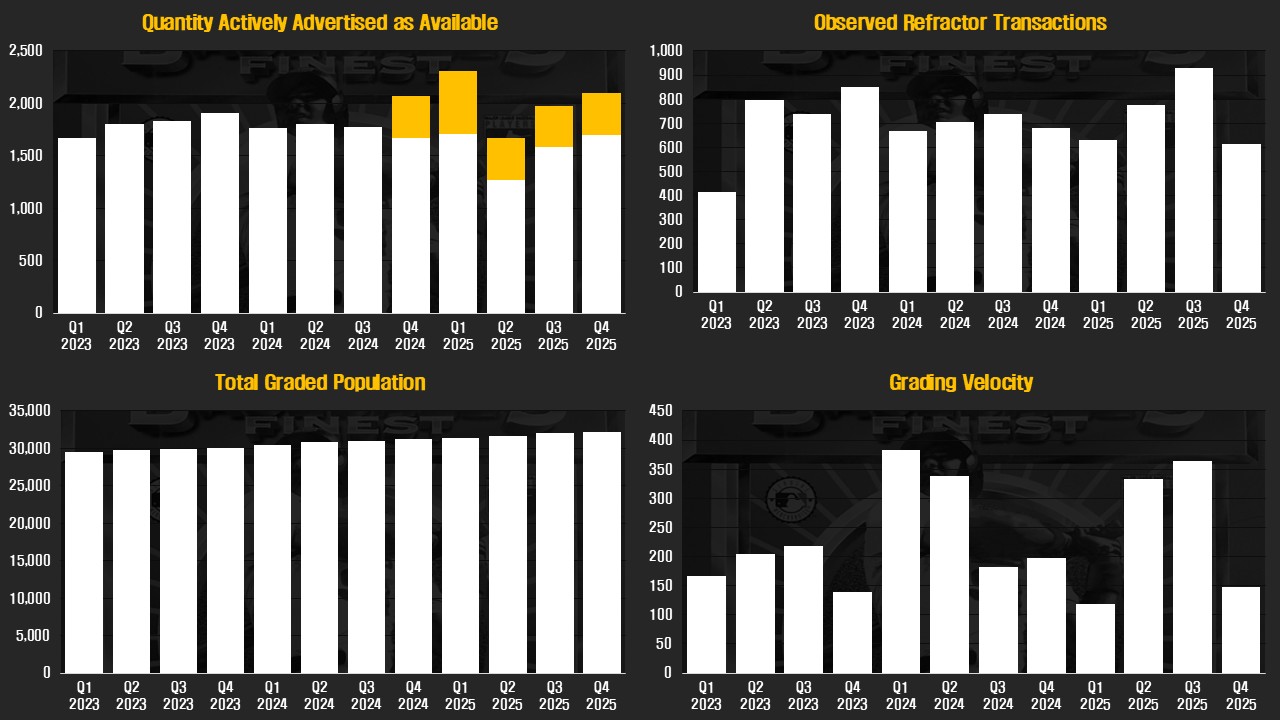
Below are several metrics showing the progression of the market for 1993 Finest Refractors. These graphs illustrate the developments of the past three years in quarterly increments. More than a dozen sources are regularly used to compile data describing the set and collector interest. Data is up to date through September 30, 2024.
Dashboard Notes:
Refractors Actively Available: Total quantity of 1993 Finest Refractors advertised across a range of online sales platforms as of the last day of the reporting period. The total is adjusted downward for individual cards listed multiple times across platforms.
Transactions Observed: Total number of refractors sold on the same platforms from which availability is sourced. These totals also include any transactions conducted personally or witnessed outside of these venues. Full details (e.g pricing) of transactions are not needed to be counted in these totals. Each column in the graph represents the total number of known transactions within a 3 month period.
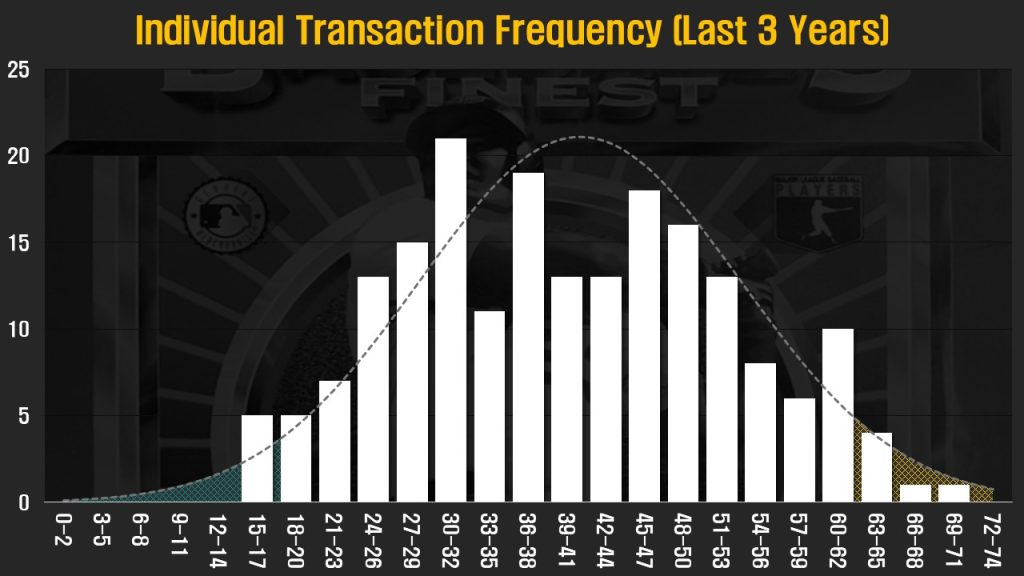
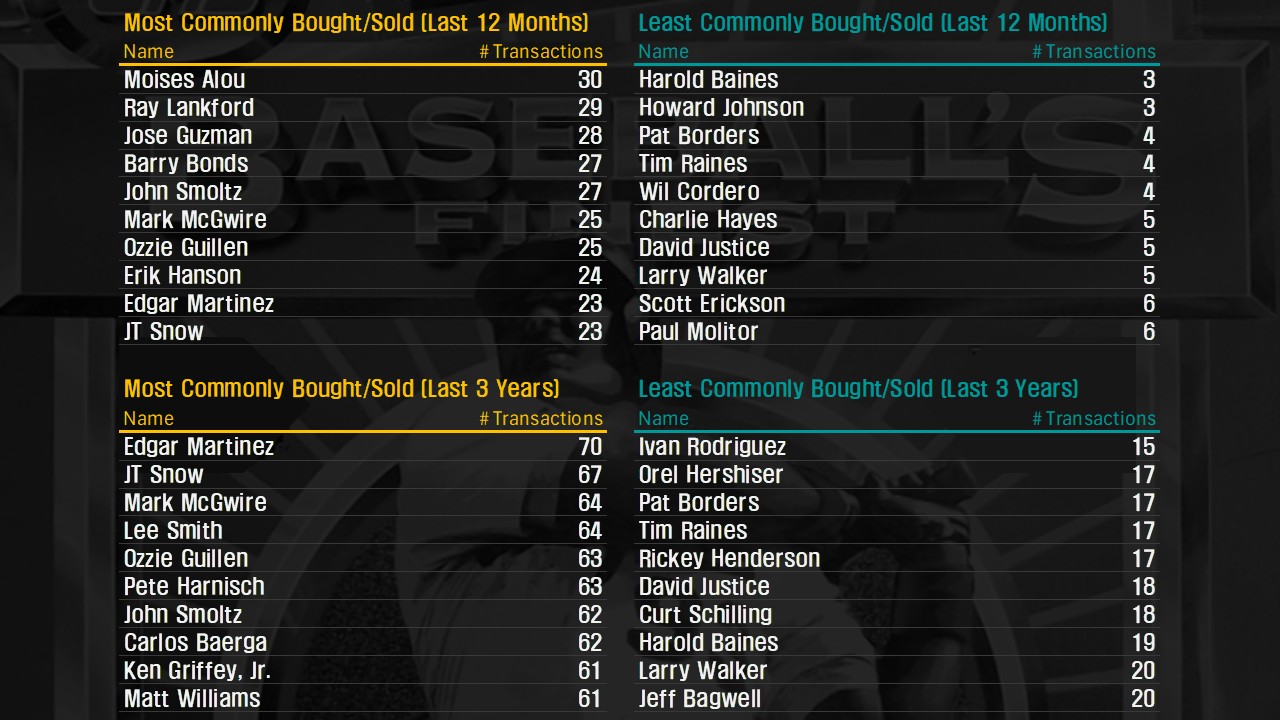
Most/Least Often Seen: Transactions with fully reported details are aggregated for the last 36 months and illustrated using a histogram. Each card in the set checklist is represented within these columns. The vertical axis reflects the number of different names observed to have changed hands within a range of transaction quantities. These transaction quantities are represented on the horizontal axis (example: cards sold between 8 and 10 times will appear above the label [8,10] ). Cards at the extremes of the distribution are identified in the orange and blue tables that follow. Grading turnover expresses the total number of transactions for a specific card by the total graded population of that card.
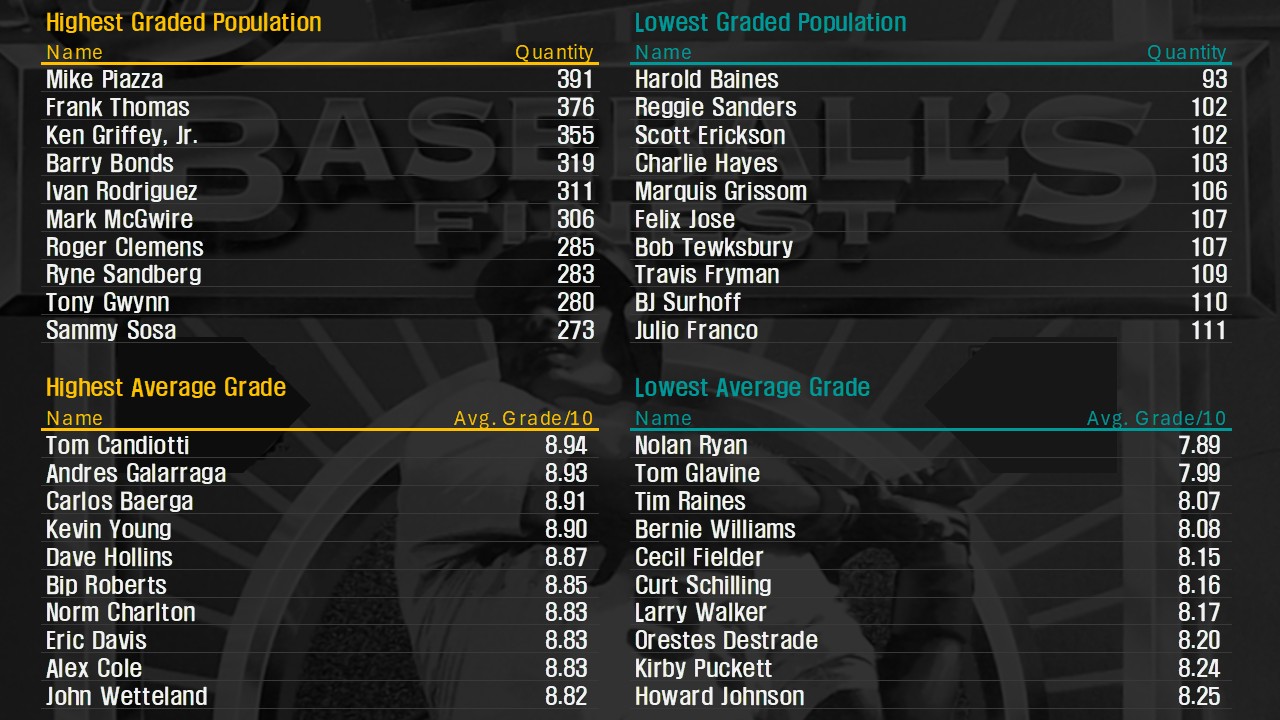
Most/Least Commonly Graded: This is a simple ranking of names in the checklist by the combined graded populations recorded at the four largest grading services.
Highest/Lowest Average Grades: Represents the average grade assigned to each card by PSA, BGS, SGC, and CSG. Grades are expressed on a scale of 1-10 and do not differentiate between grading services. Half grades are rounded down to the nearest whole number and grades with qualifiers are reduced by 2 points.
Graded Population: Represents the total number of third-party graded ’93 Refractors in the population reports of PSA, BGS, SGC, and CSG. Figures omit promos, authenticated autographs, and backless printing errors.
Grading Velocity: This metric illustrates the periodic change in total graded populations. Data is shown on a net basis, adding newly graded cards to the population and subtracting those removed from the rolls.
Did you come here looking for Phil Gold’s 93FinestRefractors.com? It no longer exists but an archived copy can be viewed at 1993 Finest Refractors (archive.org).