I frequently refer to an assortment of charts and graphs when describing aspects of developments in collecting baseball cards from the 1993 Finest Refractor set. These references may not always include all the context necessary to make full use of the information they contain. To aid in building a better understanding of this fascinating card issue I am providing the primer below. The guide is arranged alphabetically by chart title to aid navigation to areas of interest.
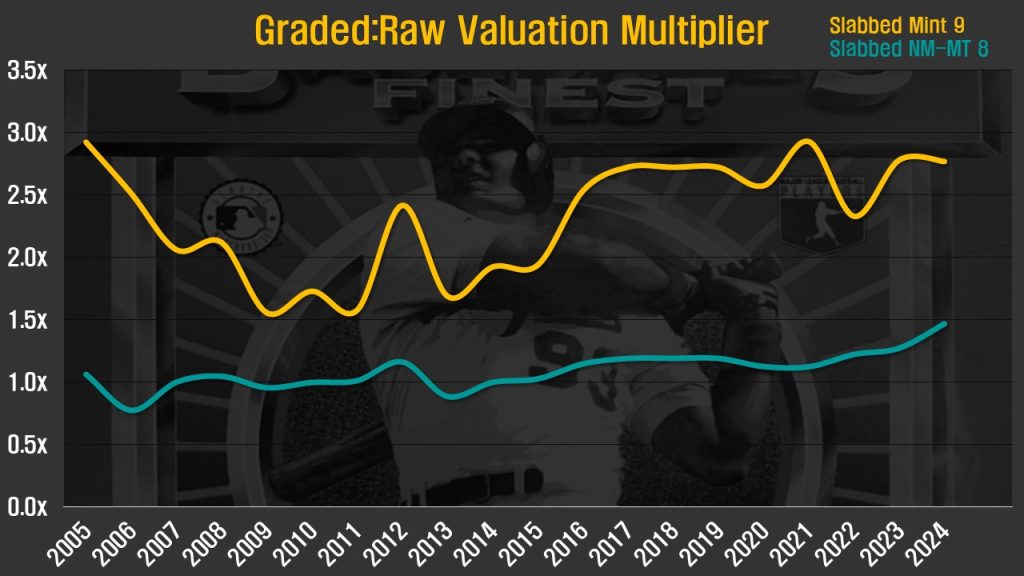
Graded:Raw Valuation Multiplier
This chart illustrates the development of condition premiums relative to ungraded cards over time. Average values for each card in the checklist are calculated annually in raw as well as slabbed Mint and NM-MT grades. Valuations are depicted on the Y-Axis and are relative to a typical raw, ungraded example of a card from the set. The teal line represents average pricing of a slabbed NM-MT 8 card against the price of the same card in an ungraded state. The example below indicates slabbed NM-MT cards are 1.5x the price of an ungraded card while slabbed Mint examples (amber line) command 2.8x the raw price at the end of 2024.
Grading Velocity
This represents the difference in total population of ’93 Refractors graded by the major third party grading services (“TPGs”) from quarter to quarter. The total population of cards slabbed by third party graders was 31,202 at the end of 2024, an increase of 198 over Q3 of that year. The graph below reflects this difference.
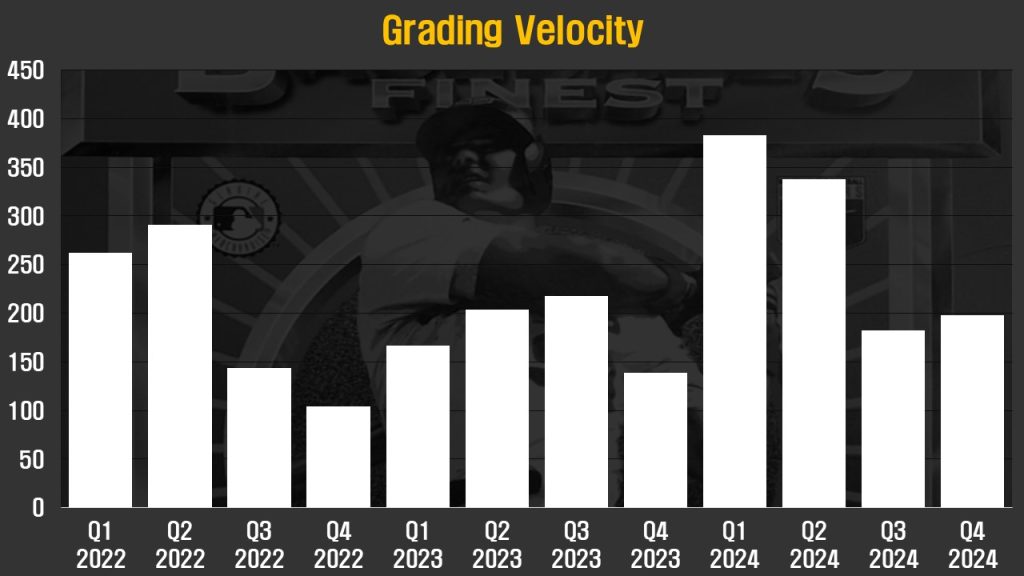
Data is collected only for cards graded by PSA, SGC, BGS, and CGC/CSG. The numbers appear on a net basis, with newly graded cards partially offset by those removed from the rolls of firms’ respective population reports. Cards are typically removed by TPGs when a mistake has been identified or upon request from collectors breaking cards out of slabs.
Highest/Lowest Grades and Populations
Population reports are referenced at PSA, SGC, BGS, and CGC/CSG to come up with a global graded population for each card in the checklist. Cards are ranked by the resulting composite population totals. Those comprising the ten most graded cards are listed under the amber column headings on the left. The ten lowest pop names appear under teal headings on the right.
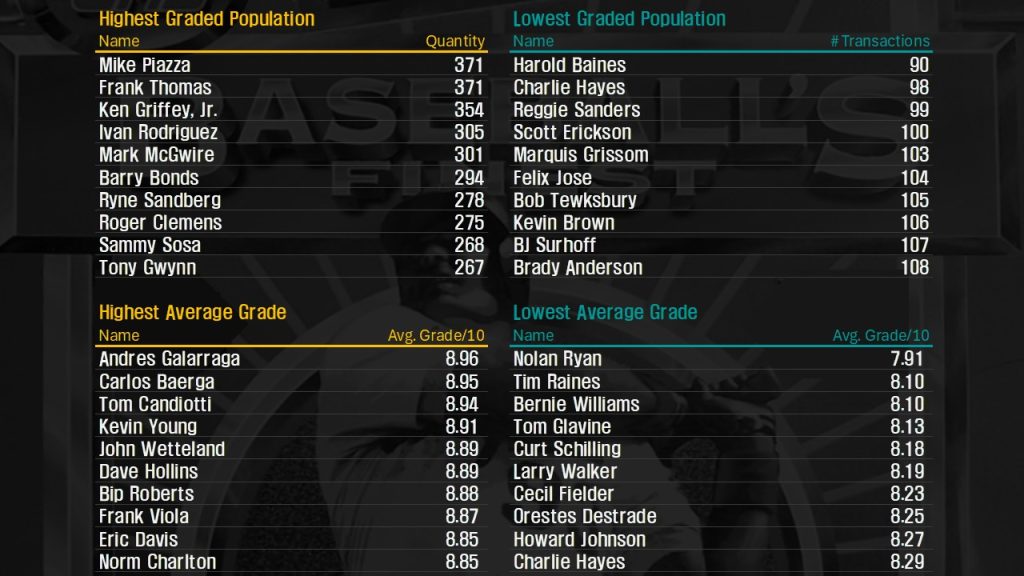
For each card in the checklist an average grade can be extracted from the composite population data. Grades are reported using the standard 10-point scale popular among the most used grading services with 10 representing a flawless card and 1 indicating poor condition. Grades with qualifiers are reduced by 2 points to account for their lower condition, a level commensurate with the adjustment applied to the ranking system used in set registries. Half grades were rounded down to the nearest whole number (e.g. PSA 8.5 becomes PSA 8) after observing a decline in the usage of half grades in the hobby and negligible collector interest in assigning any sort of condition premium to these cards.
There are a few items to keep in mind when interpreting this data. First, grading standards have shifted over time, growing stricter on the issues of centering and refractor lines. Population reports do not differentiate between the era in which a card was reviewed despite the likelihood that a different grade may be assigned if a card were to be resubmitted in the current environment.
Populations may be inflated by collectors crossing over previously graded cards to their preferred grading service. Some card owners have undoubtedly submitted the same card multiple times in hopes of obtaining a more favorable grade. Both activities may have taken place without the original grading labels being returned, artificially inflating the population report.
Indexed Complete Set Value
Refractors first appeared in price guides at the end of 1993, a time when Beckett Baseball Card Monthly reported complete sets to be trading hands at $6,000 – $8,000. As far as I can tell this is a purely hypothetical number as the earliest hand collated set I am aware of was completed three years later. By taking the sum of each card’s average December 1993 high and low price guide values I come up with a complete set valuation of $7,823, a figure that appears reasonably compatible with Beckett’s estimate.
The chart below reflects the total value of each individual card based on observed transaction prices in a raw, ungraded state as well as those slabbed by third parties in NM-MT 8 and Mint 9 grades. These sums are indexed against my estimated 1993 value, so that an equal valuation of $7,823 would represent an index value of 100. An increase to $10,000 would represent an index value of 128 and a doubling to $15,646 would generate an index value of 200.
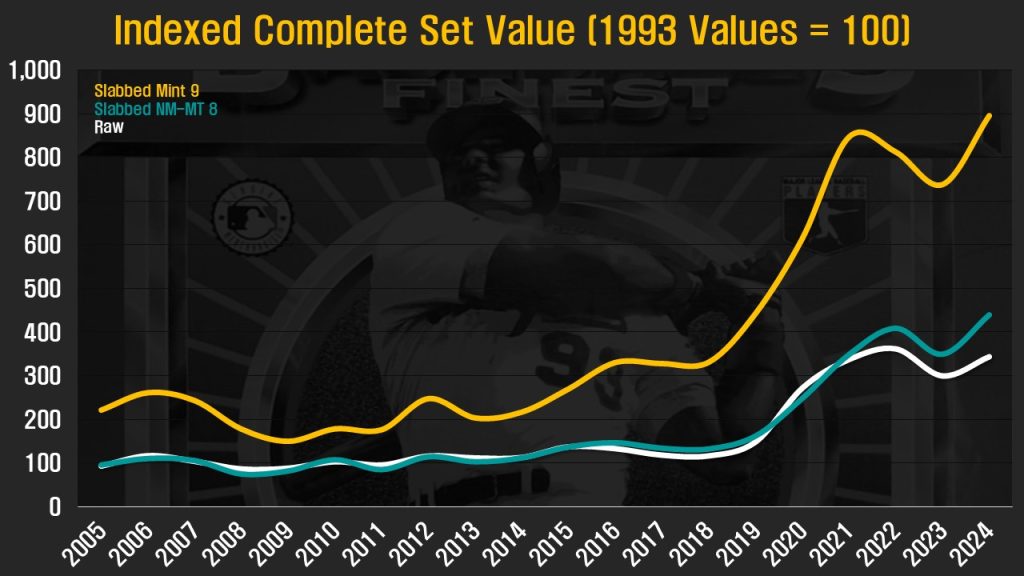
Pricing data includes the effect of auction house buyer premiums but excludes shipping costs and taxes. Half grades are rounded down to reflect collector tendencies to assign very little in the way of premiums to these cards.
Individual Transaction Frequency
More than 40,000 transaction records underpin my database of ’93 Finest Refractor information. One of the most useful ways to use this data is to identify how often any particular card in the checklist changes hands. Because cards can randomly disappear from the market for long stretches of time and suddenly emerge in bunches, I have chosen to illustrate transaction frequency by looking back over a period of three years. Shorter time periods were considered but did not lend themselves as readily to providing easy to interpret insights.
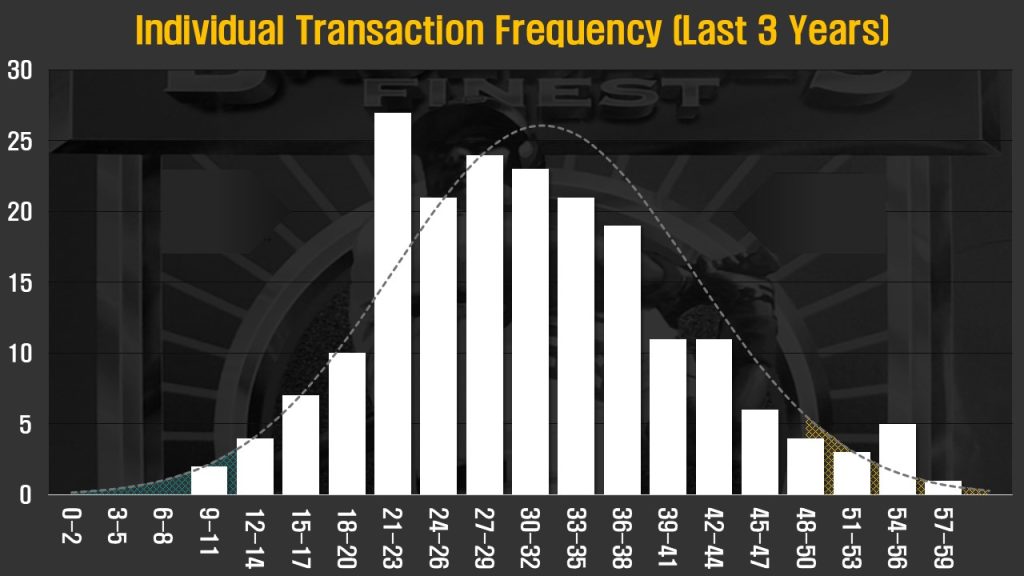
The results are plotted as a histogram in which vertical bars represent the number of cards in the checklist that have changed hands a specific number of times. There are 20 such columns in the example above, each representing a range of equal sized transaction frequencies. The tallest bar is 27 units tall and appears above the range of 21-23 on the X-Axis. This means there are 27 cards in the ’93 Finest Refractor checklist that were bought and sold between 21 and 23 times over the past three years. A card that was sold 24 times would increase the bar to the right and a card that moved 20 times would raise the bar to the left. If added together, the height of all bars would equal 199, the same quantity as the number of cards in the set’s checklist. All cards appear exactly once in this graph.
Overlaid across the histogram is a dashed line bell curve representing the expected distribution of cards using a normal distribution. This offers a rough approximation, though more mathematically inclined readers may notice the actual distribution skews somewhat towards the right tail and sometimes includes a small secondary peak when there is unusual activity around a particular set of names. While a bell curve is present in the plot, I would caution against using an assumption of normal distribution.
Additional color overlays of amber and teal appear at the tails of the bell curve. Instead of a traditional modeling convention that employs such shading to mark confidence bands and standard deviation, I use color coded textures to highlight were the most and least commonly seen cards appear on the distribution. Those ranking as the top 10 most often transacted cards over the past three years have orange shading behind their bars on the right side of the histogram. The 10 names with the lowest transaction frequencies are likewise indicated with teal shading in the background.
What IS NOT Included: Omitted from this dataset are transactions where any of the following information is missing: Sales price, transaction date, the identity of specific cards involved in the transaction. Also scrubbed are obviously fraudulent or mislabeled sales.
Market Share (Current and Last 12 Months)
This dual chart shows the relative population of ’93 Refractors graded by the four major grading services (PSA/SGC/BGS/CGC). The amber chart on the left represents the number of cards reported in these firms’ active population reports. The teal chart on the right only reflects cards graded by these services in the previous 12 months. All figures are reported on a net basis, with the removal of cards from a registry lowering the overall population.
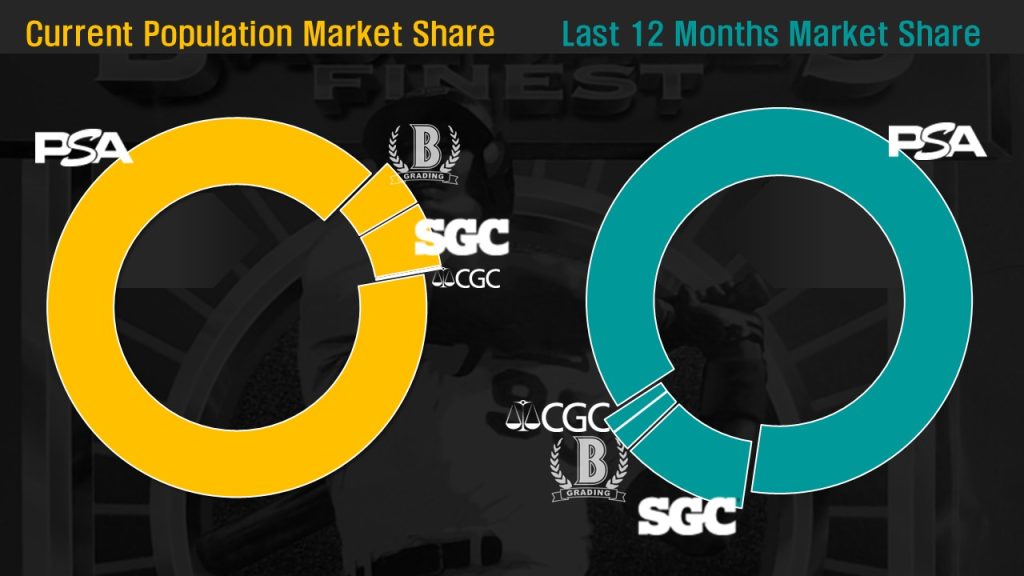
At present there are no additional third party grading services that carry both the respect of collectors and have a material presence in grading these cards.
Most Expensive Refractors
This table displays the 10 refractors with the highest average prices within the past one year period. My pricing model provides values for slabbed Mint 9 and NM-MT 8 cards, as well as ungraded copies. Values were ranked using the output for slabbed NM-MT 8 examples for the following reasons:
- NM-MT 8 pricing has historically closely matched the valuation assigned to raw cards
- A focus on the price of slabbed cards avoids the outsized impact of raw cards that may have a noticeable flaw that impacts a sale price
- Choosing NM-MT 8 grades over Mint 9 cards limits the impact of card-specific condition premiums on the valuation process
Y/Y Change compares the current reported value with the average price of the prior 12 month period. Prior Rank indicates where a particular card ranked in the previous year’s pricing model from of a descending checklist of 199 cards. An asterisk following a card price, such as Rickey Henderson in the example below, indicates no NM-MT 8 sales were recorded in the year being reviewed. Instead, pricing data from other grades was combined with their modeled relative values to create an estimated valuation.
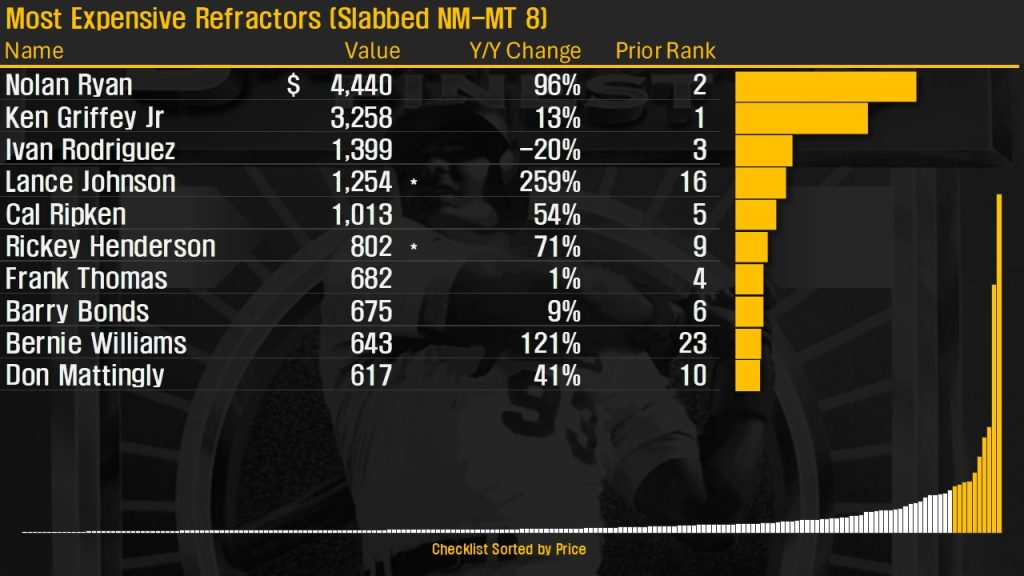
Horizontal amber bars give a visual representation of the relative value of cards within the top 10 ranking. All 199 cards are displayed in ascending price order at the bottom of the illustration. Cards within the top 10 are given amber coloring while all others falling outside this list are depicted in white.
Most/Least Commonly Bought/Sold
This table represents the cards appearing at the extremes of my refractor transaction database. Two sets of tables are generated, one representing documented transactions taking place within the last 12 months and the other reflecting an expanded view out to the previous 36 months.
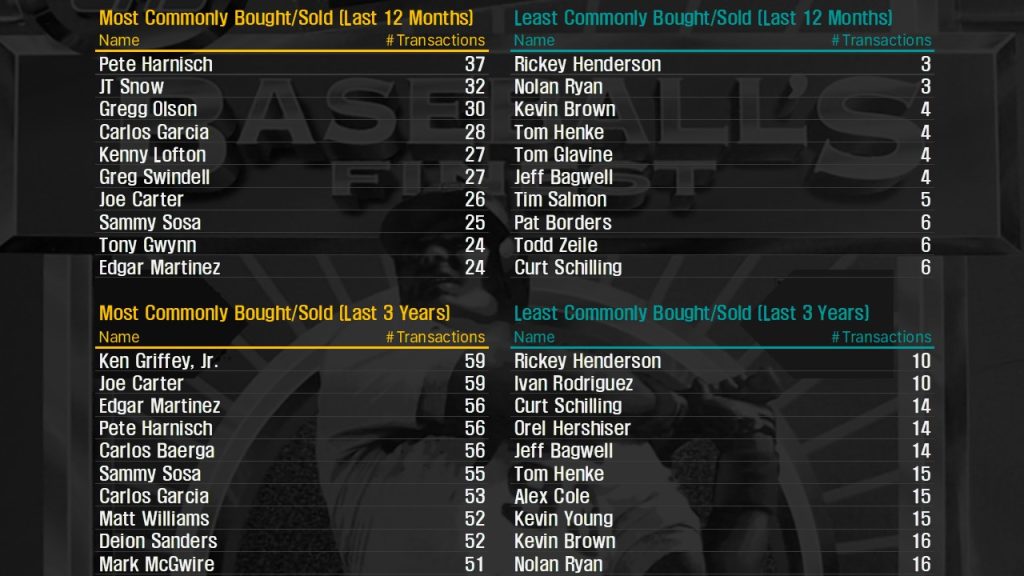
Cards are excluded from this table when they are sold in large lots from which pricing data cannot be easily extracted (example: The reported sale of a complete set will not increase transaction quantities).
Observed Refractor Transactions
This tracks the number of refractors confirmed changing hands in a given period. Data is taken from the sold listings of many online platforms and augmented by transactions that I witnessed or participated in outside of these venues. I do not travel to many large shows and canvas even fewer dealers when I do attend, so these transaction counts should be viewed as a lower bound rather than a full count of card sales. Complete details such as pricing are not needed in order to be counted in these totals, only whether or not a deal took place in the appropriate period. Transaction records are scrubbed of duplicate entries and obviously fraudulent/mislabeled items before being added to the graph.
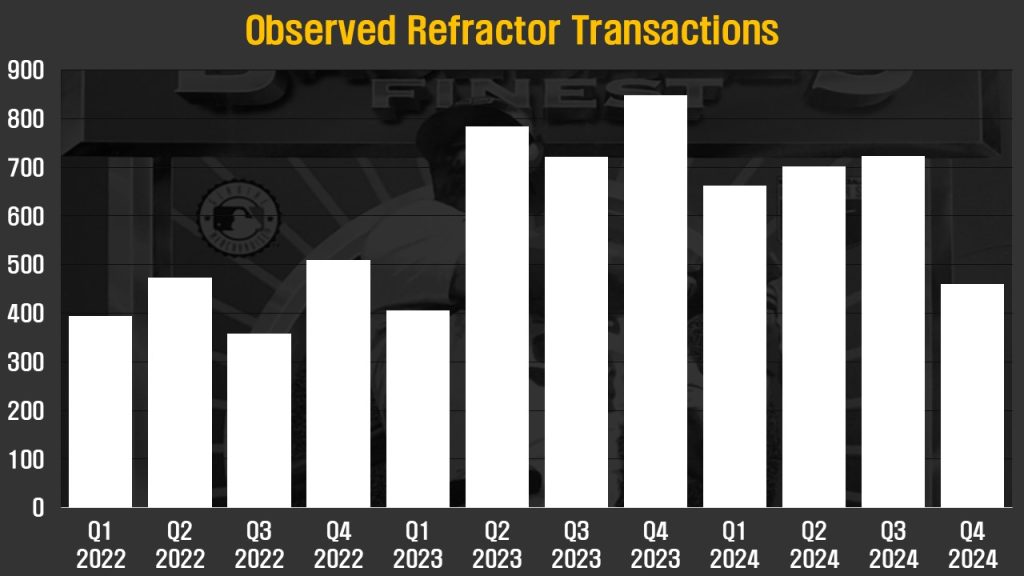
Cards sold as lots or as complete sets reflect the total number of cards moved rather than as a single item. For example, a sale of 1 complete set and a lot of 5 additional Mike Piazza cards would appear as 204 cards in the transaction count (199 card set + 5 extra cards).
Quantity Actively Advertised as Available
Tracking the total quantity of refractors advertised for sale allows a way to objectively gauge whether or not these cards are being offered more or less often than in the past. The figures illustrated below represent the sum of all advertised cards across a series on online platforms, and when possible, offline availability.
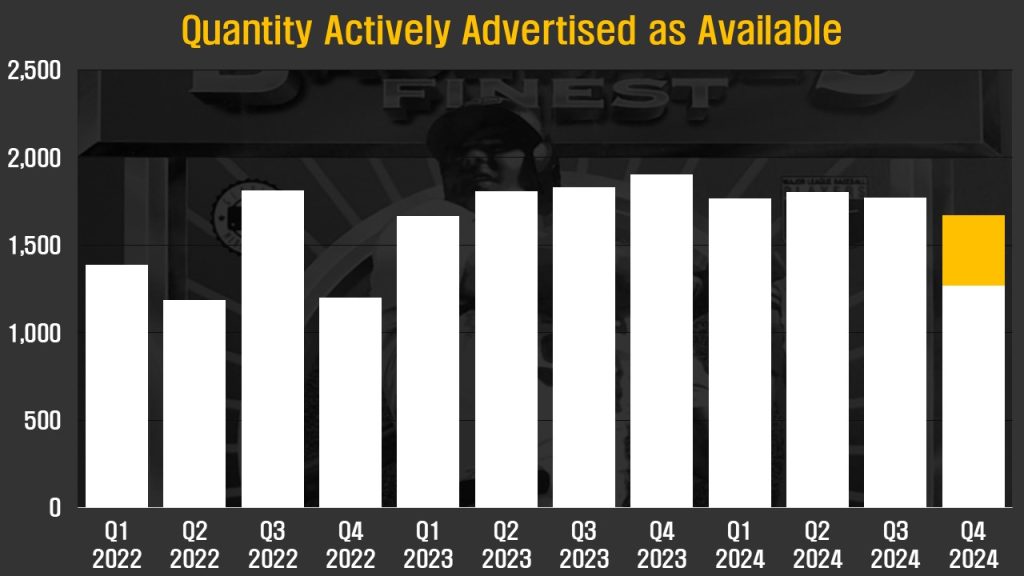
What The Numbers Include: This is the summed value of all 1993 Finest Refractors advertised as either for sale or in the active process of being auctioned as of the last day of the reporting period. Beginning with 2024 Q4 data I have broken out complete sets as a separate series (shown in amber). This is done to quantify the impact of 199-card sets being advertised against the overall number of cards available. The rest of the data (white series) reflects cards available in small lots or on an individual basis.
What IS NOT Reflected: Not considered at all in the above data are cards only advertised in physical venues such as card shows and hobby shops, unless seen in person on the report date. Unopened boxes and packs are likewise excluded. “Soft” advertisements are not considered, such as when a collector shows off a collection on social media and states they would be willing to entertain offers. Advertisements for upcoming auctions and sales are ignored if collectors are not able to place bids or purchase cards on the report date. I sift through source data listings, eliminating frauds (usually base cards advertised as refractors but sometimes using other identifiers) and misclassified cards from the population being studied. Misclassifications most often refer to refractors from other sports, cards from the wrong year, and unrelated cards brought into my data collection via sellers’ keyword spamming. Cards cross posted to multiple platforms are adjusted so they appear only once in periodic totals.
Refractors Most Often Graded in [YEAR]
This table shows the 15 refractors with the greatest net increase in graded population during the previous 12 months. The number of newly graded cards, net of those removed from population reports in the same period, are reflected in the “Newly Graded” column. The column at the far right indicates the total graded population among the big 4 grading services at the end of the period. The column titled “Y/Y Change” reflects how much the population increased over the previous 12 months to reach this new total. The net change in graded population is further broken out by grading service in the middle of the table.
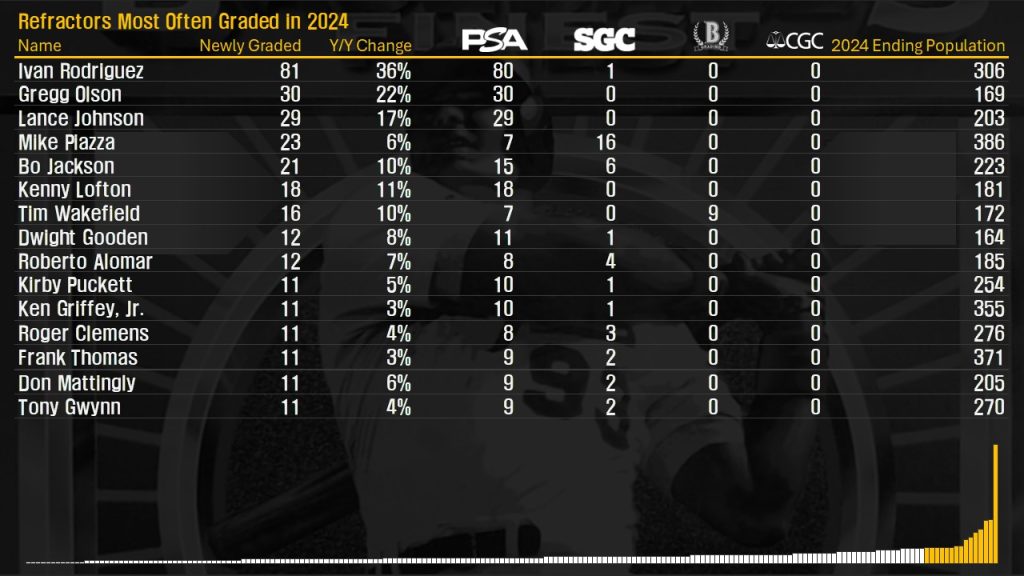
A series of columns appears at the bottom of the table representing each of the 199 cards in the checklist. The columns are arranged in increasing order from left to right by the number of examples graded within the review period. The 15 names highlighted from the table above are highlighted among the columns with amber coloring.
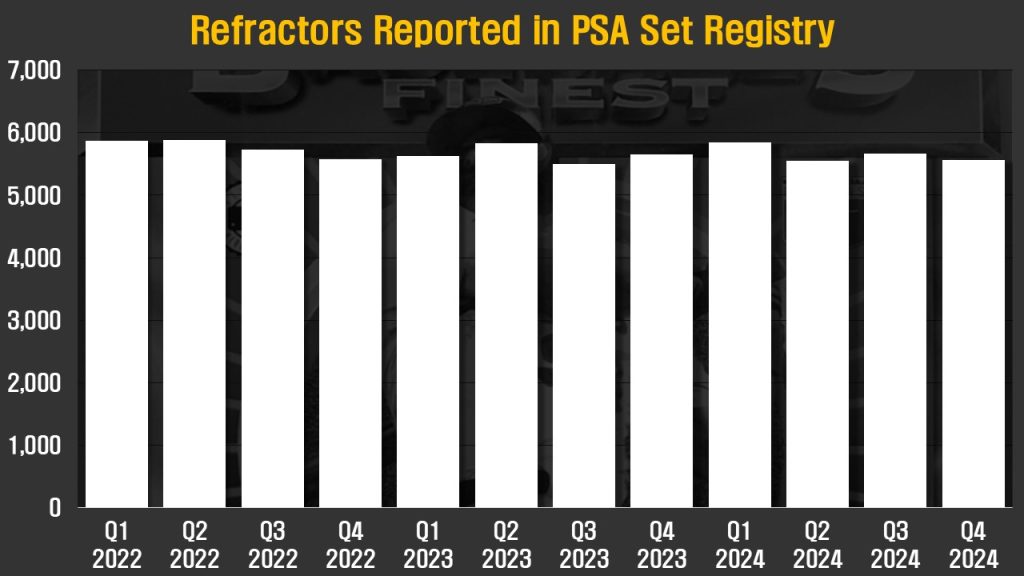
Refractors Reported in PSA Set Registry
This represents the total number of cards appearing in the 1993 Finest Refractors Set Registry at PSA. Tracking this information provides insight into two aspects of the set. Over time the set registry population should reflect rising and falling interest among collectors seeking to build full sets. I also suspect the number of registry cards bears a relationship with the quantity of cards locked away in long-term collections. PSA’s data is helpful in that the registry will not allow a slab serial number to be recorded multiple times. Only active registry sets are included in the total with retired sets being ignored.
Total Graded Population
Graded population adds up the total number of 1993 Refractors recorded in the population reports of each of the major third party grading services. Overall population numbers are inflated to an unknown degree by collectors who crack open slabbed cards and do not take steps to have the population report adjusted for this action. This may be done to better display a card, facilitate submission to a different grading service, or to prepare a card for resubmission in hopes of a more favorable assessment. My experience shows some grading services are more responsive (PSA) than others (CGC) in cleaning up their pop reports, but this ultimately relies on an honor system of collector self reporting. Total graded population should be thought of as an upper bound rather than a firm census of the number extant graded examples.

What IS Included: Only cards graded by PSA, SGC, BGS, and CGC/CSG (the “Big Four”) are included in these totals. I know for a fact that there are multiple mislabeled base cards within these totals, but do not have a scalable way to make adjustments at this time. These represent a very small part of the reported population and largely get weeded out over time.
What IS NOT Included: Cards from third party graders other than those listed above are all excluded from this population count. Autographs certified by the Big Four are excluded as they represent a small number of cards, sometimes reside in different population tables, and seem to suffer from consistency issues in labeling and refractor vs. base identification. Also excluded are cards slabbed as errors and proofs, many of which I believe originated from a problematic source and are slabbed by a rather forgiving identification team at one of the grading services.
This reference guide is likely to see further updates for the purposes of clarity and accommodating additional methods of reviewing data.
