[NOTE: This post was written prior to a significant revision in the way I calculate lifetime rankings of pitchers. While the text that follows represents the original methodology, Clemens remains the highest ranked pitcher under the new system.]
In my ranking of overall career pitching performance, I have Roger Clemens in first place and that seems odd. In all of baseball history, did I really grow up watching the best pitcher of all time? Did this guy actually beat Walter Johnson and Cy Young? Among more recent players, was he really better than Nolan Ryan and Randy Johnson?
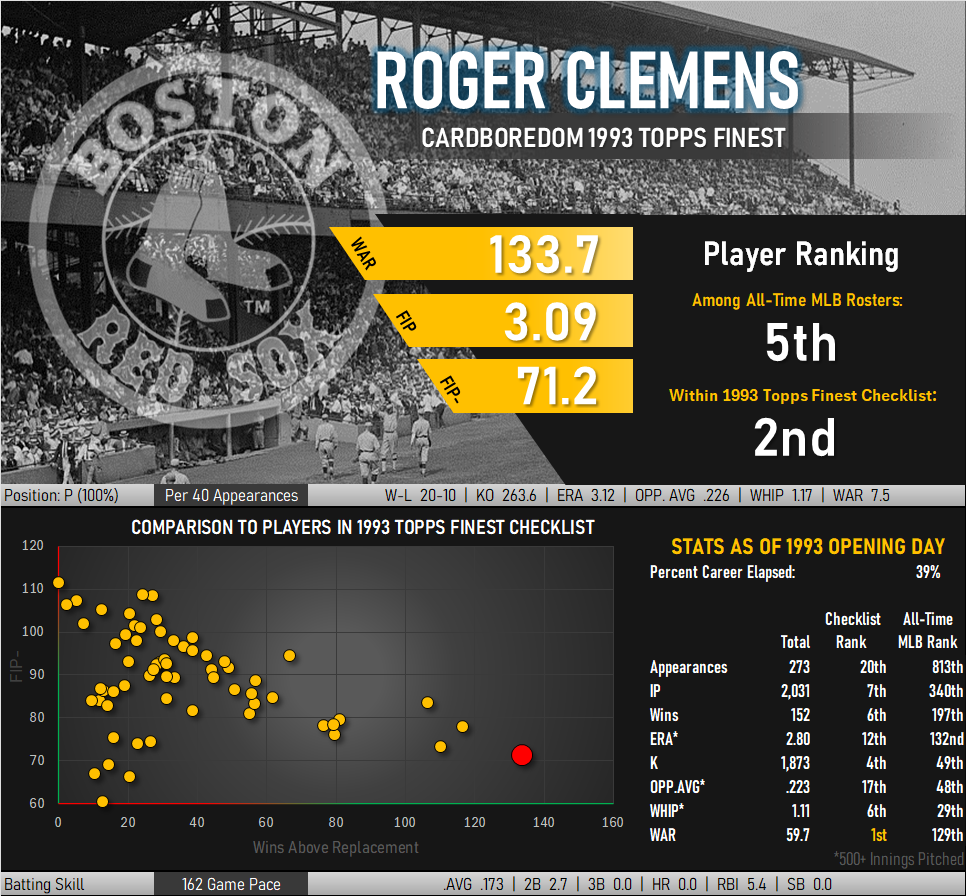
It’s worth revisiting the methodology I employ to judge overall pitching skill. I score pitchers on two related metrics; fWAR and FIP-. The first of these represents Fangraphs’ estimate of a player’s career wins above replacement. It is a cumulative statistic that measures how many additional wins a team employing the pitcher can expect compared to replacing his roster spot with a borderline AAA-callup. Clemens finished his career with 133.7 wins above replacement, just squeezing past Cy Young for the top of the all-time leaderboard at the position. The cumulative nature of the metric rewards players with substantial longevity. Clemens played for 24 seasons, a figure close to Nolan Ryan’s 27 seasons and trailing by just over 300 innings. WAR is designed to be an all-encompassing look at a player’s effectiveness and it essentially states Clemens was indeed the best pitcher of all time.
Longevity, however, can skew performance numbers. Players that rack up moderate numbers of wins over an extended period can look better than more dominant players that left the game shortly after reaching their peak. In a hypothetical head-to-head matchup you would want the high-peak player to take the mound rather than the longevity guy. How does Clemens stack up in this regard?
To account for this I turn to adjusted fielding independent pitching (FIP-), a metric once again based on Fangraphs’ calculations. FIP- looks only at pitcher/batter interactions, stripping away the effects of random chance and fielding. Walks, strikeouts, home runs, and hit batsmen are the only outcomes directly attributable to a pitcher. This metric assesses only the frequency of these events and assigns a value to each that ultimately corresponds to an expected number of runs scored against the pitcher’s team. Adjusted FIP normalizes the FIP readings for pitchers, producing a reading of 100 for average players and sub-100 values for more skilled hurlers. Clemens scores an impressive 71 on this scale, better than many of the game’s best.
To combine these metrics into a single ranking of player ability I compared each player’s WAR and FIP- against the all-time best readings for both categories and multiplied by 100. Each category was given a weight to keep excellence in a single area from overwhelming the other. A two-thirds weighting was applied to WAR with the remainder to FIP-. Adjusted FIP was underweighted because Fangraphs’ calculation of WAR already makes use of FIP. Equal weighting of the two metrics would have the effect of overweighting FIP’s importance in the ranking.
What if the Rating Methodology Were Slightly Changed?
The weights I used in my ranking are admittedly a bit arbitrary. I have not sat down and tried to back out the exact impact of FIP from the WAR model. The relative value of dominance (low FIP) versus effective career longevity (WAR) varies with each observer. My rankings only produce their exact results with this 67/33 weighting. What do the top 10 look like at different weights?
| Rank | 33% WAR 67% FIP- | 50% WAR 50% FIP- | 67% WAR 33% FIP- | 75% WAR 25% FIP- |
|---|---|---|---|---|
| Best | Aroldis Chapman | Roger Clemens | Roger Clemens | Roger Clemens |
| 2nd | Craig Kimbrel | Randy Johnson | Cy Young | Cy Young |
| 3rd | Dellin Betances | Pedro Martinez | Walter Johnson | Walter Johnson |
| 4th | Emmanuel Clase | Walter Johnson | Randy Johnson | Randy Johnson |
| 5th | Roger Clemens | Cy Young | Greg Maddux | Greg Maddux |
| 6th | Kenley Jansen | Aroldis Chapman | Pedro Martinez | Nolan Ryan |
| 7th | Carson Smith | Craig Kimbrel | Nolan Ryan | Pedro Martinez |
| 8th | Ken Giles | Greg Maddux | Christy Mathewson | Bert Blyleven |
| 9th | Mariano Rivera | Mariano Rivera | Bert Blyleven | Christy Mathewson |
| 10th | Rob Dibble | Clayton Kershaw | Lefty Grove | Pete Alexander |
Clemens tops the leaderboard on any composite score that gives at least 50% weighting to WAR, something that is to be expected given his excellent career numbers. Inverting the weighting to 33% WAR and 67% adjusted FIP, however, makes the model go bonkers. Modern relief pitchers take 9 of the top 10 slots. Their smaller workload and elevated strikeout rates jump past players who had to chew through opposing batting orders multiple times in a game. Their limited accumulation of WAR is no longer a liability once their FIP scores overtake most of the scoring system. There is absolutely no way relievers from the past couple decades are truly 9 of the top 10 greatest pitchers of all time, implying weights somewhere towards the right hand side of the table are more likely correct. Clemens scores at the top of all of these, keeping the bullpen out of the discussion. A pitcher that can keep the bullpen shut down is all you really need.
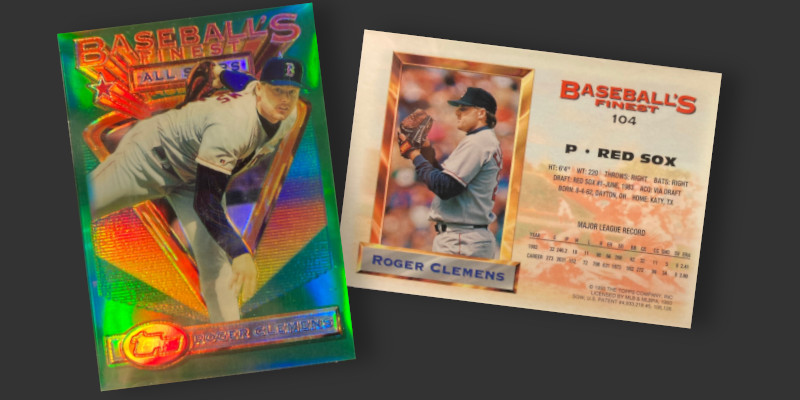
Getting a Clemens Refractor into the Collection
Clemens is one of the best pitchers of all time, and scarce cards of players with his performance record can sometimes be challenging to obtain. A series of self-inflicted miscues has dampened collector enthusiasm for his cards, keeping this card from attaining the hobby status of those of Nolan Ryan or Randy Johnson.
Clemens is depicted as an All-Star in Topps’ guess as to what 1993’s roster would look like. Clemens was indeed a reserve in the 1992 game but missed the ’93 roster. Topps wasn’t just taking cues from the past for its All-Star checklist, as the ’92 AL starting pitcher Kevin Brown appears only on a base design in the Finest set. They missed again in ’93, placing AL starter Mark Langston on a base design and omitting the NL’s Terry Mulholland entirely.
This particular example was acquired from REA alongside my Frank Thomas. Both cards are viewed as being Near-Mint/Mint by PSA, but this one is clearly the higher grade example of the pair. The top-bottom centering is off but otherwise the card is great.