
Earlier this year I completed a set of 2001 Finest Origins Refractors. The cards are a great looking follow up to the original 1993 release and were randomly inserted into packs of 2001 Topps Finest. The original set became famous when collectors figured out that only a few hundred cards were created. Like their 1993 counterparts there was no official statement confirming the extent of 2001 refractor production. As I built the set, I wondered how many cards were printed. Fortunately, Topps left enough breadcrumbs in the fine print of its packaging to make a fairly good estimate.
Starting Information
The 2001 Finest set was distributed in two formats. Cards arrived at hobby shops in either 20-pack “hobby” boxes or 10-pack “jumbo” boxes that featured more cards. Wrappers for both included fine print on the back that laid out the odds for finding various inserts. The 15 Origins insert cards were inserted at a rate of 1:7 packs per hobby box and 1:4 in jumbo packs. My focus, Origins Refractors, arrived at a rate of 1:40 hobby packs and 1:20 jumbo packs.
Knowing only the odds on the packaging does little to help without a reference point to overall production. Topps provided just that when it stated the odds of finding each of five different serial-numbered inserts. With serial numbering we know exactly how many cards exist and can combine this with the odds of finding them to determine how many packs were produced. This data is summarized in the table below:
| INSERT | # CARDS IN SET | SERIAL #’D UP TO | TOTAL CARDS PRODUCED | HOBBY ODDS (1:N PACKS) | JUMBO ODDS (1:N PACKS) |
|---|---|---|---|---|---|
| Origins Refractors | 15 | N/A | 15 x ?? = ?? | 1:40 | 1:20 |
| Standout Veterans | 10 | 1,999 | 10 x 1,999 = 19,990 | 1:32 | 1:15 |
| Standout Refractors | 10 | 399 | 10 x 399 = 3,990 | 1:159 | 1:73 |
| Prospects | 30 | 999 | 30 x 999 = 29,970 | 1:21 | 1:10 |
| Prospect Refractors | 30 | 241 | 30 x 241 = 7,230 | 1:88 | 1:40 |
| Base Refractors | 100 | 499 | 100 x 499 = 49,900 | 1:13 | 1:6 |
Accounting for Wiggle Room in the Odds
Odds of finding each insert type are presented in integers with no room for decimals. I find it unlikely that overall production would match so evenly with the stated odds and find it more probable that Topps rounded the actual likelihood to the nearest whole number. Taking the odds to decimal places produces a range of possible insertion rates with a midpoint at the level printed on the packaging. Using the Standout Veterans insert as an example, the odds of finding one in a hobby park are not 1:32 but rather a range of outcomes between 1:31.50 and 1:32.49. Both extremes of the range round to 1:32. Given the known production quantities of serial numbered cards we can use these ranges to produce high and low bounds on the number of overall boxes produced. With the exact ratio of hobby to jumbo production unknown I made two estimates: one consisting of 100% hobby boxes and the other 100% jumbos. While a bit fuzzy, this does give the absolute maximum and minimum for potential 2001 Finest production.

| 100% HOBBY (20 Packs/Box) | Total # Cards | Odds | Odds Range | Lowest Estimate | Highest Estimate |
|---|---|---|---|---|---|
| Standout Vets | 19,990 | 1:32 | 1: 31.5-32.49 | 31,485 | 32,473 |
| Standout Refractors | 3,990 | 1:159 | 1: 158.5-159.49 | 31,621 | 31,818 |
| Prospects | 29,970 | 1:21 | 1: 20.5-21.49 | 30,720 | 32,202 |
| Prospect Refractors | 7,230 | 1:88 | 1: 87.5-88.49 | 31,632 | 31,989 |
| Base Refractors | 49,900 | 1:13 | 1: 12.5-13.49 | 31,188 | 33,657 |
| 100% JUMBO (10 Packs/Box) | Total # Cards | Odds | Odds Range | Lowest Estimate | Highest Estimate |
|---|---|---|---|---|---|
| Standout Vets | 19,900 | 1:15 | 1: 14.5-15.49 | 28,986 | 30,964 |
| Standout Refractors | 3,990 | 1:73 | 1: 72.5-73.49 | 28,928 | 29,322 |
| Prospects | 29,970 | 1:10 | 1: 9.5-10.49 | 28,472 | 31,438 |
| Prospect Refractors | 7,230 | 1:40 | 1: 39.5-40.49 | 28,559 | 29,274 |
| Base Refractors | 49,900 | 1:6 | 1: 5.5-6.49 | 27,445 | 32,385 |
So How Many Origins Refractors Were Made?
The above tables assume production is 100% allocated to either hobby or jumbo boxes. By overlapping the high and low production estimates for each insert, a viable production range is found between each tables’ yellow-highlighted estimates. These estimates of the number of boxes produced can be entered into the formula below along with the odds of pulling an Origins Refractor to get an idea of the number of Origin Refractors produced.
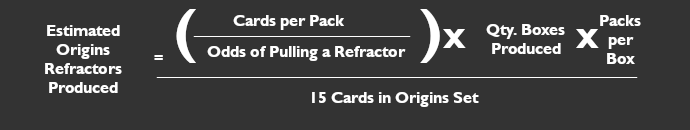
Using 1:39.5-40.49 odds for hobby boxes produces a production range of 1,047-1,067 Origins Refractors. The same method generates of range of 952-990 for jumbo boxes (1:19.5-20.49 odds). Combining these figures we can deduce there are at least 952 Origins Refractors and no more than 1,067 produced. The exact production ratio of hobby to jumbo boxes is not published, though the calculations run earlier that assume 100% production of either kind give us solid bookends for the estimate and do not introduce any new uncertainties. It is unlikely that Topps skewed production too far in any one product direction (e.g. 1% hobby and 99% jumbo), so I have more confidence near the middle of this range. Given Topps’ penchant for printing cards in round or nearly round numbers, this estimated range makes it likely that total production was 999 or 1,000 of each card.