

JULY 23, 2024 NOTE: The methodology laid out below is no longer in force, having been replaced by the system described here. Thank you for not letting Bill James, Tom Tango, or anyone else who knows what they are doing see any of this.
The stat lines printed on the back of baseball cards can often be one of the most interesting components of a card. From this information arguments can be settled (or started) over who was truly a better player. This is never a straight forward conversation as there is no single metric that clearly defines a better player.
Further clouding the discussion are biases fans bring towards their favorite measuring sticks. I myself favor batting performance over fielding work despite both contributing towards the outcome of a game. When a batter puts a ball in play and a fielder snags it from the air for an out, I view this as a failure on the part of the hitter rather than a success for the fielder. Both interpretations can coexist but they never appear equal from my view in the stands.
Another issue that makes comparisons difficult is player longevity and the production arc of their careers. Some, such as Hank Aaron, put up impressive numbers for decades. Others (e.g. Ken Griffey, Jr.) put up better numbers for shorter periods but see their production tumble with age or injury. Fans arguing for either player will point to their respective strengths to make their point.
Throughout my writing I will be interspersing relative player rankings. Studying players across multiple eras has brought about the need to apply consistent metrics for making comparisons, an endeavor that led me to create a simple numerical score for every batter. In brief, my comparison method uses wins above replacement and weighted on base average to rank player performance. These capture individual power and provide adjustments for secondary skills and longevity. None of what follows should be considered scientifically rigorous. Bill James, please do not yell at me. I’m just having fun.
Wins Above Replacement (WAR)
The first metric I use in evaluating a player’s relative performance is career wins above replacement (WAR). This is a single number that seeks to capture the number of wins a player adds to his team compared to what would have happened if they were replaced by a marginal player. This is done through the lens of a player’s batting statistics, baserunning effectiveness, and defensive fielding performance. In calculating WAR, a number of hypothetical runs are ascribed to each action taken by a player. These runs are totaled up and divided by the number of runs estimated to be needed to eke out one extra win over the course of a season (~10 runs). Once this is complete, the number of wins ascribed to the player in question is then lowered by what a typical marginal player would have produced. Negative readings for a single season indicate a player should probably not be on a major league roster, as the team could instead grab a random minor leaguer to take his place and theoretically perform better. Numbers in the low single-digits indicate limited MLB-prowess, while figures near 5.0 show someone who should be on the starting roster of the All-Star Game. A single season WAR around 8.0 is in strong contention for the MVP award and double-digits can make observers wonder if Babe Ruth has been reincarnated.
For my purposes I choose to focus on career WAR, which looks across the entire span of a player’s career. This helps highlight players who are able to perform at an exceptional level for extended periods of time, as lengthy careers allow more time to accumulate higher figures.
There are drawbacks, however, to only using WAR to rank players. While longevity is a wonderful quality in a top level player, its cumulative nature can inflate lifetime rankings for more pedestrian players. WAR is also based on comparisons to a marginal player. When a team loses a highly compensated player like Albert Pujols, they are not necessarily starting over with nothing in finding a replacement. Instead, a team makes the calculation of comparing Pujols’ production with what they can get from the same level of resources employed. An extra $25 million in annual payroll space can buy a team lots of WAR.
The calculations that produce a WAR figure incorporate an adjustment for the positions a player takes in the field. Highly demanding positions such as catcher and shortstop receive sizeable boosts while designated hitters and peripheral outfielders see their performance discounted. I am not a general manager searching for value among positional scarcity, but rather a fan looking to be entertained. As a result, I view the positional adjustments as a bit too heavy-handed on my personal player values.
WAR is a useful starting place for ranking performance and for this reason I use it for a portion of my rankings. Adding a second (related) statistic makes the conversation more interesting.
Weighted On-Base Average (wOBA) is the batting component that goes into calculating WAR. It assigns weights to various methods of getting on base, essentially combining the best parts of batting average, slugging percentage, and on base percentage. Weights are derived from analysis of how each on-base outcome ultimately leads to run creation across baseball history. This metric stands out to me because I personally enjoy watching hitting more than all but the best baserunning and defense.
Viewing wOBA outside the context of WAR allows an appreciation of just how good a hitter a player was regardless of position. Expressed as a percentage, the metric also strips away the added points that accrue simply due to longer careers. A player with a wOBA above .400 simply terrorized opposing pitchers regardless of playing 5, 10, or 20 years. Adding this data to the peripheral skills and longevity reflected in WAR can produce an informative result.
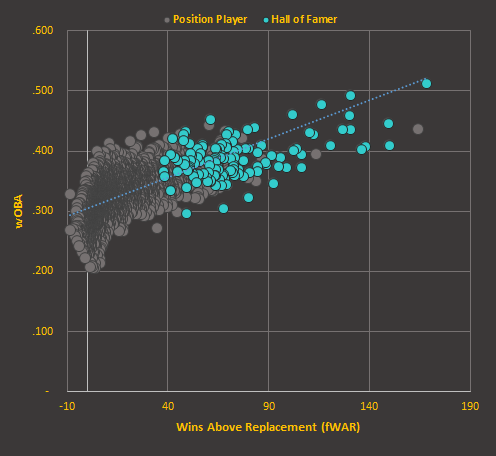
Visualizing WAR and wOBA
The relationship between WAR and wOBA can be plotted on a graph, such as the one below depicting the 4,000 most active batters across MLB history. Players plotted further to the right likely contributed more wins to their respective teams. Those approaching the top of the vertical axis showed greater hitting prowess than those lower down. The dashed trendline depicts the positive correlation that would be expected between WAR and its wOBA component.
Combining WAR and wOBA to Rank Players
My goal is to produce a single number by which I can rank my perceptions of player effectiveness. Ranking players by only WAR or wOBA produces different relative standings and each is subject to issues that are problematic. WAR includes defensive position adjustments to its output while not allowing prolific but short-tenured hitters to advance through the ranks. As an example, Mo Vaughn was much more fun to watch than Benny Santiago despite both ending their careers with very similar WAR totals. wOBA likewise has shortcomings with zero credit given to defense, stolen bases, and longevity.
For my personal rankings I assign each batter a score of 0-100. Babe Ruth represents a perfect score of 100 as his 168.4 career WAR and .513 wOBA are both all-time batting records. Any future player scoring above 100 is easily in the discussion for best player of all time.
My personal rankings give each player up to 67 points for career WAR. To calculate this number, a player’s WAR is expressed as a fraction of Ruth’s total and multiple by 67. wOBA contributes another potential 33 points and is calculating in the same manner in comparison with Ruth. The smaller weight given to wOBA reflects the double counting effect that is present given that it is already a component of calculating WAR.
Example: Comparing Yankee Fan Favorites to Babe Ruth
| Name | WAR | 67 x (WAR ÷ Ruth WAR) | WAR Points | wOBA | 33 x (wOBA ÷ Ruth wOBA) | wOBA Points | Score (WAR Pts. + wOBA Pts.) |
|---|---|---|---|---|---|---|---|
| Ruth | 168.4 | 67x(168.4÷168.4)=67.0 | 67.0 | .513 | 33x(.513÷.513)= | 33.0 | 100.0 |
| Gehrig | 116.3 | 67x(116.3÷168.4)=46.3 | 46.3 | .477 | 33x(.477÷.513)= | 30.7 | 77.0 |
| Mantle | 112.3 | 67x(112.3÷168.4)=44.7 | 44.7 | .428 | 33x(.428÷.513)= | 27.5 | 72.2 |
| Jeter | 73.1 | 67x(73.1÷168.4)=29.1 | 29.1 | .360 | 33x(.360÷.513)= | 23.2 | 52.2 |
| Mattingly | 40.7 | 67x(40.7÷168.4)=16.2 | 16.2 | .361 | 33x(.361÷.513)= | 23.2 | 39.4 |
The end results seem to produce a palatable ranking and do not appear to produce too much weirdness. The 67/33 split used in the calculation is a bit arbitrary, so players falling within a range of a few points are likely interchangeable.
Top 5 batters of all time using the combined metric:
| Player | Score |
|---|---|
| Babe Ruth | 100.0 |
| Barry Bonds | 93.3 |
| Ty Cobb | 88.0 |
| Willie Mays | 85.9 |
| Ted Williams | 83.7 |
These metrics will never fully do away with the ability to quibble over player rankings. The “what if” possibilities are endless, such as imagining where Ted Williams should rank if he hadn’t missed a half decade of peak playing time with military service. Some all time great players were kept out of MLB baseball until they were already in their late 20s or 30s. Others experienced injuries that derailed their later performance.
I’m pretty happy with the methodology employed in my rankings. It leans heavily on metrics that have gained widespread use only in recent decades. These will likely be augmented in future years by even more interesting takes on the subject. Jay Jaffe’s JAWS system is one such metric worth exploring and I encourage anyone interested in a player’s peak performance to look into it.
The upper tier of my rankings can be viewed here.