Imagine if you will an alternate baseball history. The setting is the early 1993 and the sport is excited for the expansion debuts of teams in Colorado and Florida. Good vibes are flowing in the office of the commissioner. Instead of pursuing a Martingale Strategy of increasingly absurd denials, Pete Rose had instead fessed up and apologized to fans. Moved by an outpouring of forgiveness, the sport had changed his banishment into a suspended sentence of “time served.”
Rose, growing miraculously more confident, signs as a surprise free agent with the Colorado Rockies for one final season at age 52. He then proceeds to go 640 for 640 at the plate with the air of Coors Field transforming each hit into a homerun. Rose rides into the Rocky Mountain sunset (a night game for us on the East Coast) with 4,896 career hits, a .339 batting average, and an astounding 800 career homeruns. Nobody can accuse his record of being one emblematic of simply compiling counting stats: His SABR credentials must surely be off the charts. Indeed, his hypothetical career on-base plus slugging (OPS) jumps 181 points at .965 at the end of this imaginary season.
If a player actually accomplished the feats of this multiverse version of Pete Rose he would immediately be crowned the greatest of all time. Fans of the game cannot help but argue small points, so I imagine there would still be some armchair debate over the finer points of these numbers. Take that OPS figure for example. A reading of .965 is undoubtedly top-notch, but the Rockies of the 1990s had another regular in their lineup who put an identical figure while also winning the same number of batting titles and MVP awards as Rose.
The key to this metric is the way in which it combines two stats familiar to many fans of the game. OPS is simply the addition of on base (OBP) and slugging percentage (SLG). The former accounts for how often a player gets on base, benefitting those who hit for contact and draw walks. Slugging focuses on an abundance of extra base hits, the kinds of knocks that typically drive in runs. Rose had famously cobbled together more than 4,000 hits, but more than 3,200 of these were singles and were accompanied by good but not great levels of drawing walks. Rose’s actual OBP of .375 is not too far off his career slugging mark of .409.
Actual Colorado Rockies player Larry Walker, on the other hand, generated a batting average 10 points better than Rose while drawing 10% more walks per plate appearance. More than 40% of his hits went for extra bases and included almost 400 homeruns. This was a remarkable level of production that grows even more interesting when players other than Rose are brought out of retirement to burnish their credentials. Hank Aaron needs more than 100 HRs to bring his offense up to Walker’s numbers while Cal Ripken needs to hit 516 consecutive dingers to raise his OPS to a similar level.
But, But…Coors!
Larry Walker’s name is one of the first mentioned when describing the high scoring run environment of 1990s Colorado baseball. It seems as if anyone wanted to look past these tremendous stats can simply ignore the numbers by waving a dismissive hand and uttering with finality, “Coors.”
Yes, Larry Walker played in the pinball machine that was Coors Field in this period. However, he barely played 30% of his career in Colorado home games, a percentage that further declines in importance when one realizes that the final 4 seasons of his career, 2½ of which were as a Rockie, took place after the introduction of a humidor to the park negated much of that offensive tailwind.
Fine. Let’s assume for the sake of argument that Walker never played in Coors Field. After all, that massive outfield doesn’t go away just by adjusting relative humidity. What would Walker’s stats look like if we erase those 2,156 at-bats from his record and extrapolate all his non-Coors numbers to fill the void?
| Scenario | .AVG | H | 2B | 3B | SB | HR | .SLG | OPS |
|---|---|---|---|---|---|---|---|---|
| Actual Career | .313 | 2,160 | 471 | 62 | 230 | 383 | .565 | .965 |
| Omit Pre-Humidor Coors | .288 | 1,990 | 426 | 51 | 209 | 333 | .509 | .891 |
| Zero Coors Games | .282 | 1,947 | 422 | 44 | 225 | 331 | .499 | .873 |
OK. I see the opposition’s point. Larry Walker was demonstrably better at higher altitudes. I’ll discount his performance just as soon as the people who bring up the Coors effect start marking down the offensive totals of those who played in short fenced hitters’ parks.
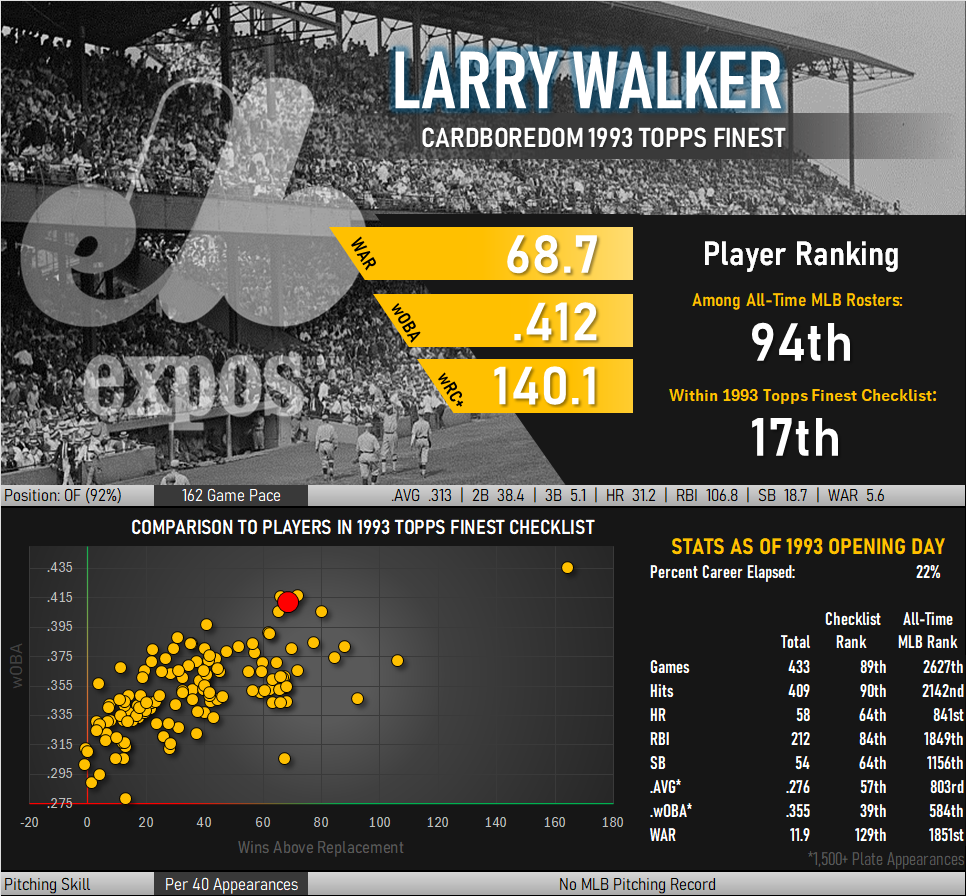
Incidentally, Fangraphs’ wRC+ metric attempts to adjust offensive production for just these kinds of park environments. A score of 100 represents a typical batter with higher scores indicating more productive contributions from the batters box. Those who benefitted from thin air and short fences see their score reduced to account for greater run scoring environments and overall scoring trends across eras. Walker posted an impressive wRC+ of 140 over the course of his career, a number equal to the output of Mike Piazza, Jason Giambi, and Mookie Betts.
Mystery Solved?
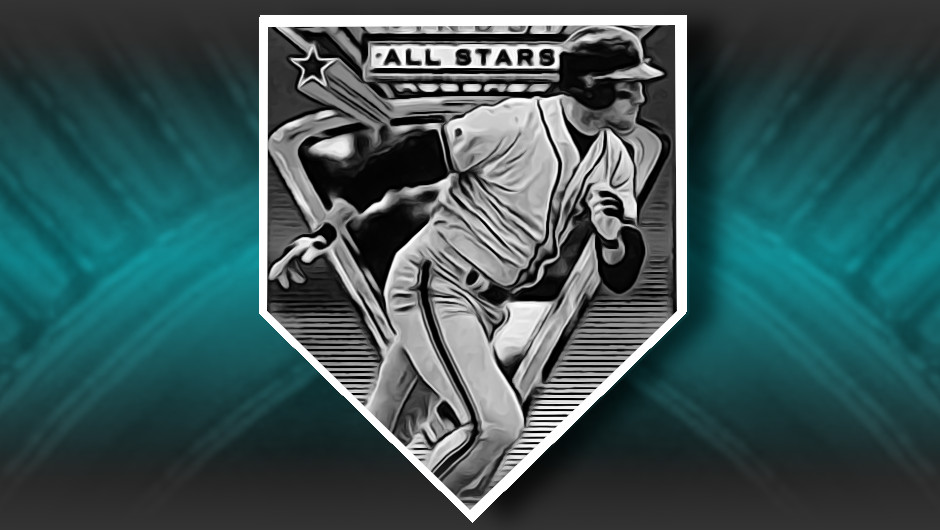
Walker is depicted as an All-Star in the ’93 Finest set, the only member of the Montreal Expos in the checklist to receive this treatment. Topps was essentially saying Walker was the best player on the team, a judgement that appears prescient with 30 years of hindsight. He was joined on the ’92 NL roster by teammate Dennis Martinez, a player that was unfortunately omitted from the Finest set.
This card was a bit of a challenge to obtain, something to which I attribute to a pair of underlying causes. The first is something readily understandable: Walker is part of the Hall of Fame’s Class of 2020. His induction coincided with a massive rush back into baseball cards. Collections were dusted off, interests rekindled, and a wave of collector interest began bidding up prices for cards of interest. Walker’s 1990 rookie cards, the pieces of cardboard usually considered the most desirable in a player run, were issued as part of the junkiest junk wax produced. Those looking for a challenging card of the newest Cooperstown invitee found only one early card of note: Walker’s 1993 Refractor. Limited production met heightened demand and suddenly this card experienced a turbocharged bump that made acquisition challenging on any semblance of sane terms.
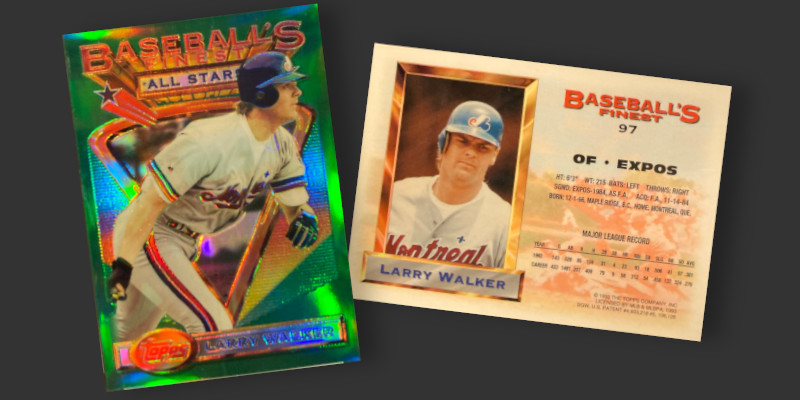
That said, the card seems to have been marginally tougher to locate than your standard refractor. It was never designated as one of the mythical short-prints in price guides, but did begin carrying a notation as being particularly condition sensitive compared to most of the checklist. I believe I recently solved the mystery of the short-prints, and based on my theory this card should have been designated as one.
How is it that I, as a collector who believes Topps didn’t short-print specific cards in the set, come to have a workable theory about cards that are harder to find than others? I initially fell into the camp that thought SPs were entirely the work of player-specific hoards but have since come up with a complementary theory that satisfies both the hoarding hypothesis and other unique attributes of the sales histories of these cards. Studying this card helped everything fall into place and I hope to present the full explanation soon. The popular history of these cards just might to be changed.
