JULY 23, 2024 NOTE: The methodology laid out below is no longer in force, having been replaced by the system described here. Thank you for not letting Bill James, Tom Tango, or anyone else who knows what they are doing see any of this.
The metrics I previously laid out for comparing position players do not completely translate to their pitching counterparts.
Once again wins above replacement (WAR) forms the starting point for ranking players. I use WAR figures calculated by Fangraphs (methodology fully explained here). This metric estimates the number of additional wins a pitcher contributes to a team over the course of a career compared to what a marginal player can be expected to add. Calculations start with measurable outcomes that only involve the pitcher and the batter and are then adjusted for leverage and the effects of different leagues and parks. WAR is cumulative and can reflect positively on players who stayed productive for extended periods of time.
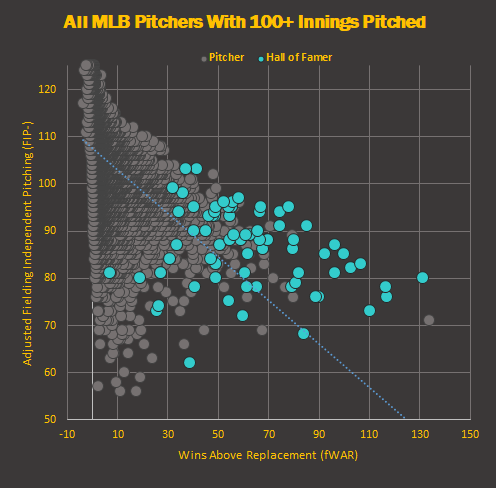
Cumulative metrics do have the drawback of building up the relative standing of players with long careers who were very good but not great. For this reason I also look at adjusted fielding independent pitching, a rate stat that is the building block of Fangraph’s version of pitching WAR. Often abbreviated as FIP-, this metric starts with pitcher-controlled outcomes (home runs given up, walks, strikeouts, and batters hit by pitch). This ignores the results of other balls put in play as opponents’ batting average on balls in play is fairly constant over time and the defense of a pitcher’s team has more influence than the pitcher on individual outcomes. FIP- is an adjusted statistic, meaning additional scaling is applied to make results comparable across parks, leagues, and even eras. FIP- applies scaling factors to raise or lower FIP so that average pitching results in a score of 100. Less skilled pitchers produce a FIP- greater than 100 while better players produce sub-100 readings.
To compare players I create a composite score of up to 100 points based on both WAR and FIP-. While both figures are essentially variations of FIP, the former offers a cumulative look at performance while the other shows relative dominance as a rate. Each component is weighted and compared to an ideal state (WAR vs. Babe Ruth and FIP- against the lowest total for any 1,000+IP pitcher).
Top five pitchers of all time using the composite score:
| Name | FIP- | WAR | Composite Score |
|---|---|---|---|
| Roger Clemens | 71 | 133.7 | 78.4 |
| Cy Young | 80 | 131.5 | 69.7 |
| Walter Johnson | 76 | 117.1 | 67.4 |
| Randy Johnson | 73 | 110.4 | 67.4 |
| Greg Maddux | 78 | 116.7 | 65.5 |
There is a caveat to this table: I’m ignoring most relief pitchers. Relievers produce odd results in any ranking. Used only briefly in games, fans generally don’t see how fatigue would affect performance after a half game of work. Aroldis Chapman ranks among the highest composite-scoring pitchers of all time if relievers are included. His MLB stats in relief are great, but his pitching record as a starter in Cuba begs the question of how effective he would have been as a regular starter in the rotation. To account for this I am only reviewing pitchers with at least 1,000 innings pitched over the course of their careers.
The resulting Top 50 pitcher rankings can be seen here.